Issue Stats
The Issue Stats dashboard gives you an organization-wide view of QMonitor issues. It combines a snapshot of currently open issues with historical data about issues being created and closed. Use the open-issue panels to find where issues are concentrated, then use the trend panels to understand how the backlog is changing.
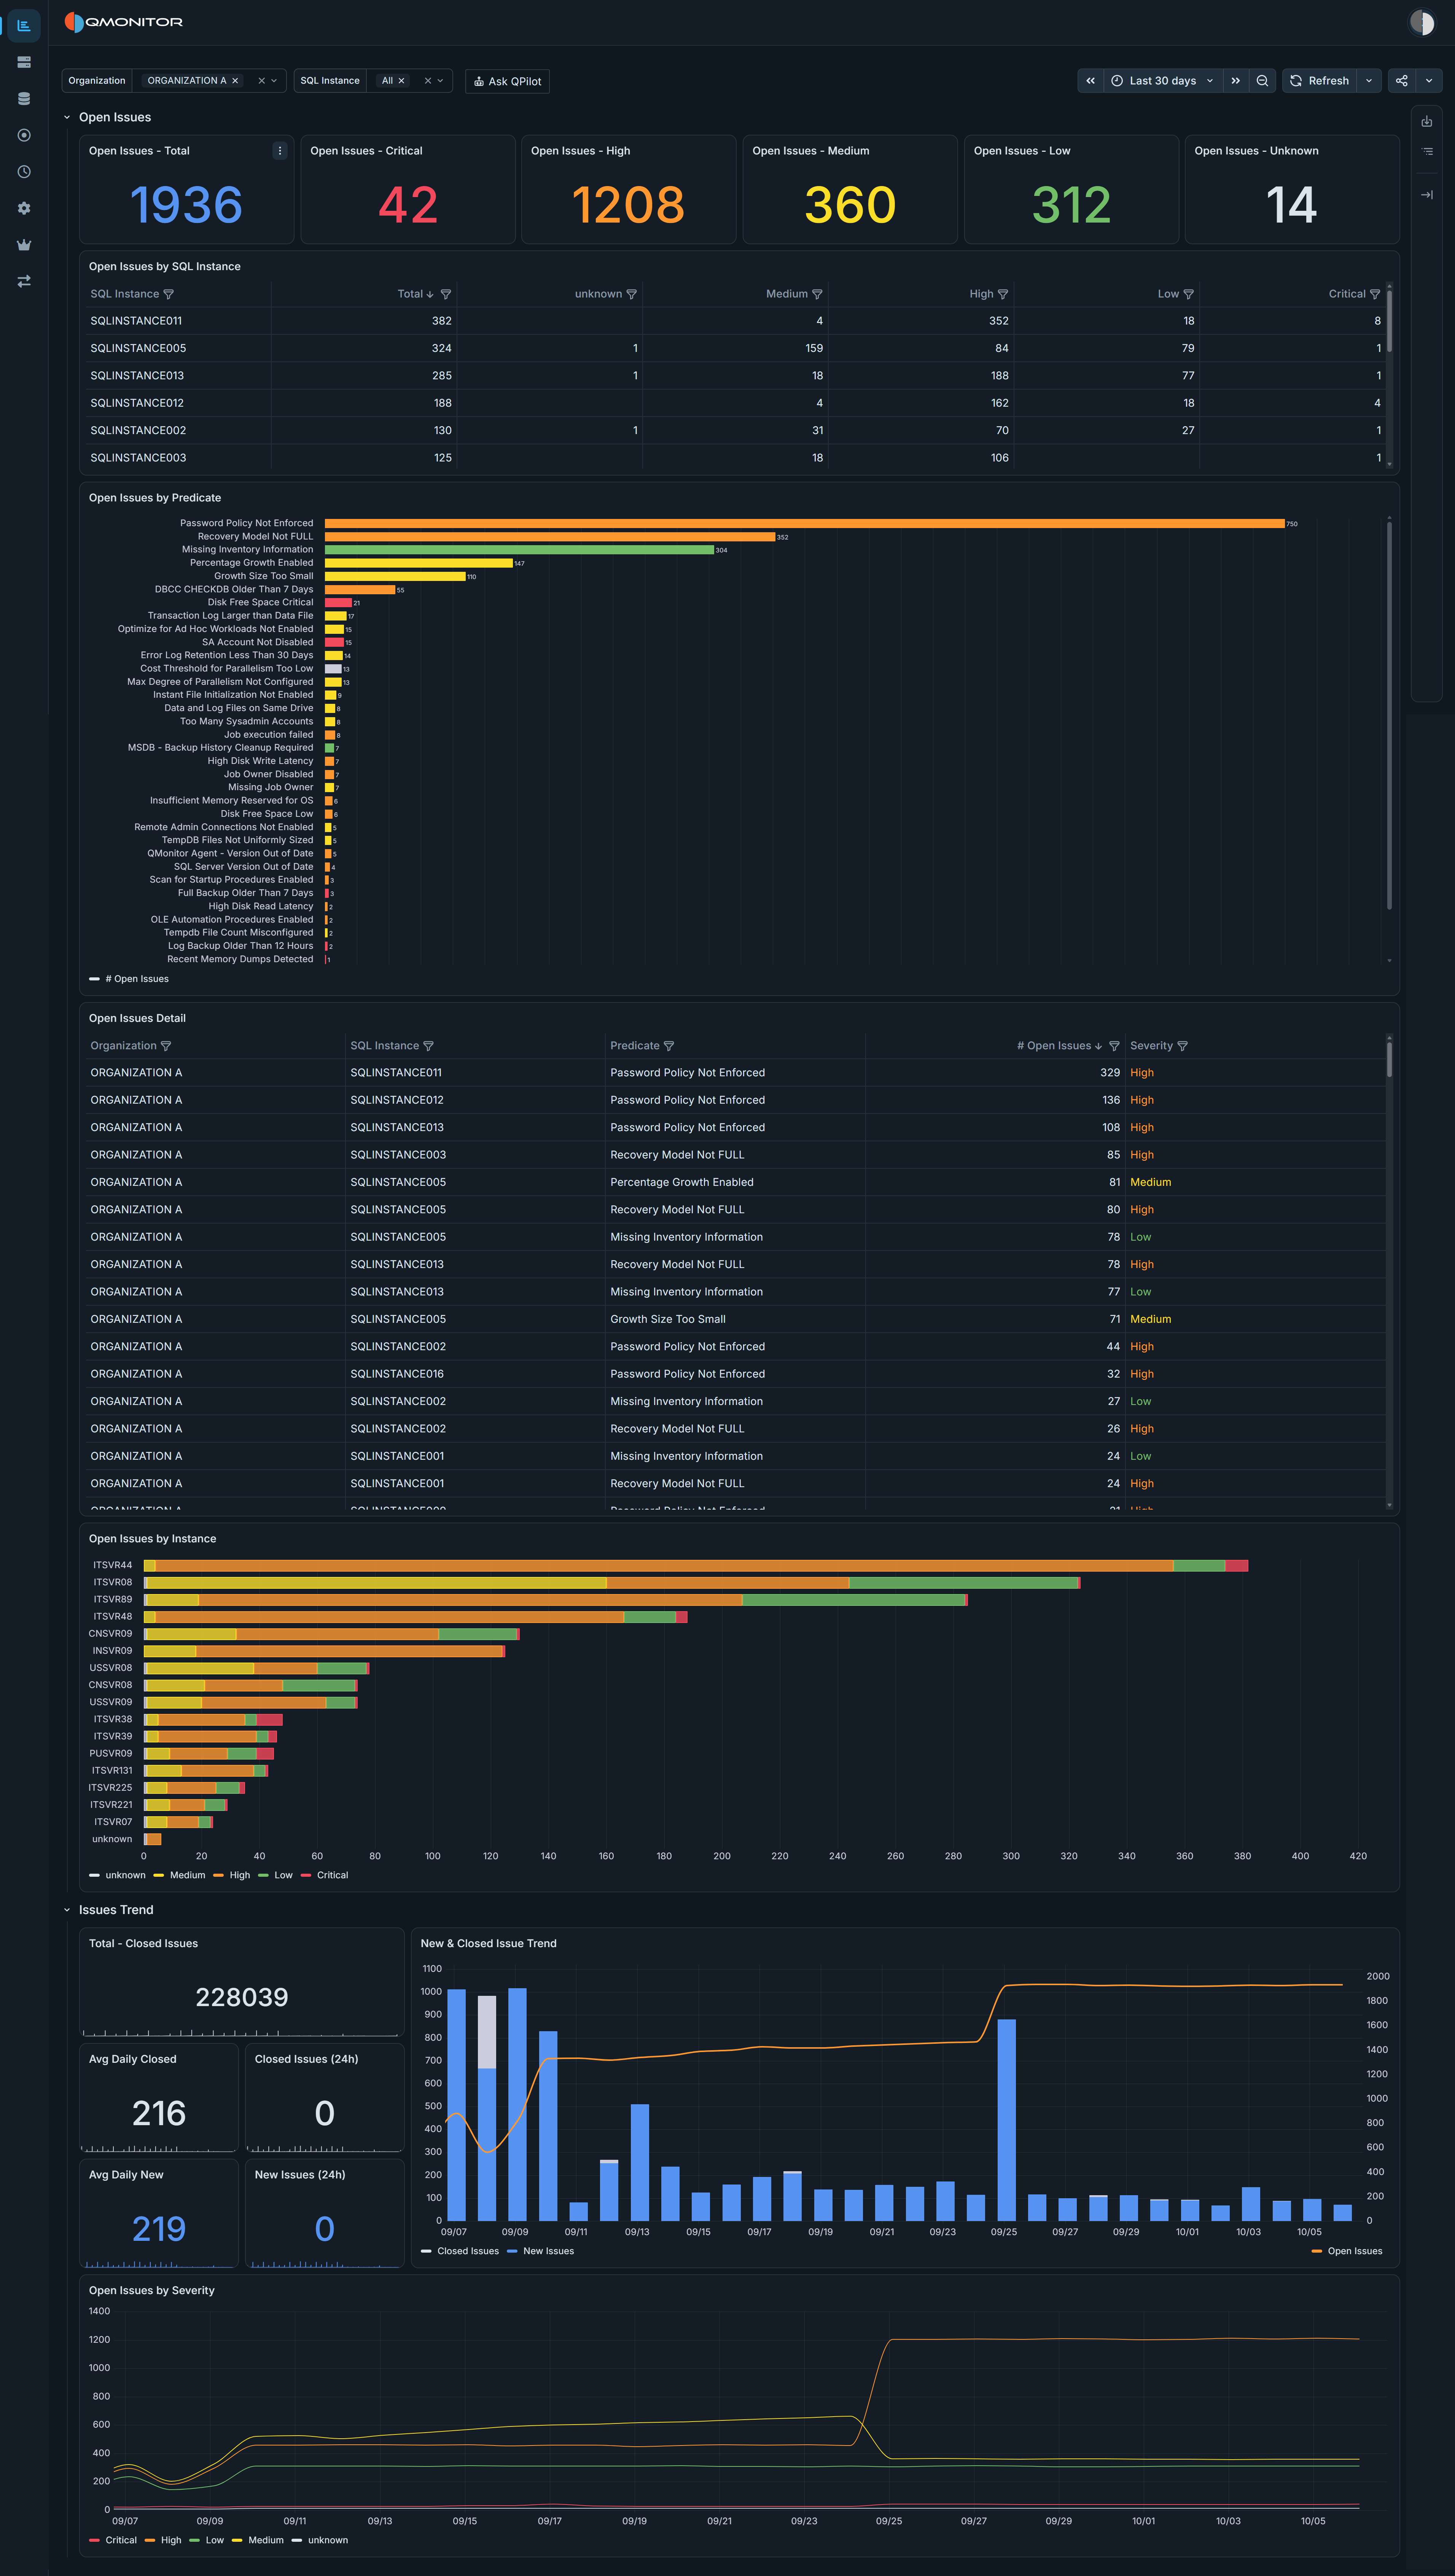 Issue Stats dashboard showing open issue summaries, instance and predicate breakdowns, and historical trends
Current Issues and Historical Trends
The Open Issues section shows the current open issue inventory. Its values are not limited to the selected dashboard time range. The Issues Trend section is historical and follows the selected time range.Filters
Use the filters at the top of the dashboard to control which issues are included:
- Organization supports selecting multiple organizations. The dashboard includes only the selected organizations.
- SQL Instance supports selecting one or more SQL Server instances. Use All to include all available instances.
- Time range controls the historical trend charts and the trend summary values.
The organization and instance filters narrow the open-issue tables and charts. The historical charts use the selected organization and instance filters together with the dashboard time range.
Open Issues
The Open Issues section helps you understand the current backlog: how many issues are open, how severe they are, and which instances or predicates account for the most issues.
Severity Summary
The six tiles at the top show Open Issues - Total and counts for Critical, High, Medium, Low, and Unknown severity. Use the total to gauge the size of the backlog and the severity tiles to see whether the most urgent issues are contributing to it. Unknown groups open issues that do not have one of the displayed severity levels.
Open Issues by SQL Instance
This table summarizes the open issue count for each SQL Server instance. It includes a total and separate columns for Unknown, Medium, High, Low, and Critical issues. The table is useful for comparing the overall issue load across servers and identifying instances with a concentration of high or critical issues.
Open Issues by Predicate
The horizontal bar chart ranks issue predicates by their open issue count, with the largest counts shown first. Colors represent severity, so the chart shows both which issue conditions occur most often and their severity mix. Use it to spot recurring predicates across the selected organization and instances.
Open Issues Detail
This table lists the open issue results used for the dashboard breakdowns. Its columns are:
- Organization: the organization associated with the issue.
- SQL Instance: the SQL Server instance where the issue was detected.
- Predicate: the issue condition or rule that was met.
- # Open Issues: the count of open issues for that organization, instance, predicate, and severity.
- Severity: the severity assigned to the issue.
The table is sorted by # Open Issues in descending order, putting the largest groups first. Use the organization and instance filters to narrow the results when investigating a specific part of the estate.
Open Issues by Instance
This stacked horizontal bar chart compares open issue counts across SQL Server instances. Each bar is split into severity segments, making it easy to compare both the total count and severity composition between instances. Instances with the largest total counts appear first.
Issues Trend
The Issues Trend section summarizes and charts issue activity over the selected time range. These panels help you distinguish a growing backlog from a stable or improving one.
Trend Summary
The summary tiles show:
- Total - Closed Issues: the total number of issues closed during the selected trend period.
- Avg Daily Closed: the average daily number of issues closed during that period.
- Closed Issues (24h): the number of issues closed in the last 24 hours.
- Avg Daily New: the average daily number of new issues during that period.
- New Issues (24h): the number of new issues in the last 24 hours.
Compare new issues with closed issues to understand whether the team is resolving issues at a pace that keeps up with incoming work. Daily averages help put short-term counts in context, particularly when the selected range spans weeks or months.
New & Closed Issue Trend
The chart displays daily New Issues and Closed Issues as bars, along with Open Issues as a line. The bars show the volume of issues entering and leaving the backlog; the line shows how the open count changes over time.
If new issues repeatedly exceed closed issues while the open-issue line rises, the backlog is growing. If closures keep pace with new issues and the line falls, the backlog is being reduced. Use the time picker to compare different periods or investigate when the trend changed.
Open Issues by Severity
This time-series chart shows the open issue count over time, split into Critical, High, Medium, Low, and Unknown severity. Use it to see which severity levels are contributing to a changing backlog and whether urgent issues are increasing or decreasing.
Investigation Workflow
- Select the organization and SQL Server instances you want to investigate.
- Review the severity tiles, then use Open Issues by SQL Instance and Open Issues by Predicate to find where the largest or most severe issue groups occur.
- Check Open Issues Detail to see the organization, instance, predicate, issue count, and severity for those groups.
- Set the time range and compare new issues, closed issues, and the open-issue trend to understand whether the backlog is improving or worsening.