SQL Server Events
Events analysis
The Events dashboard shows the number of events that occurred on the SQL
Server instance during the selected time range.
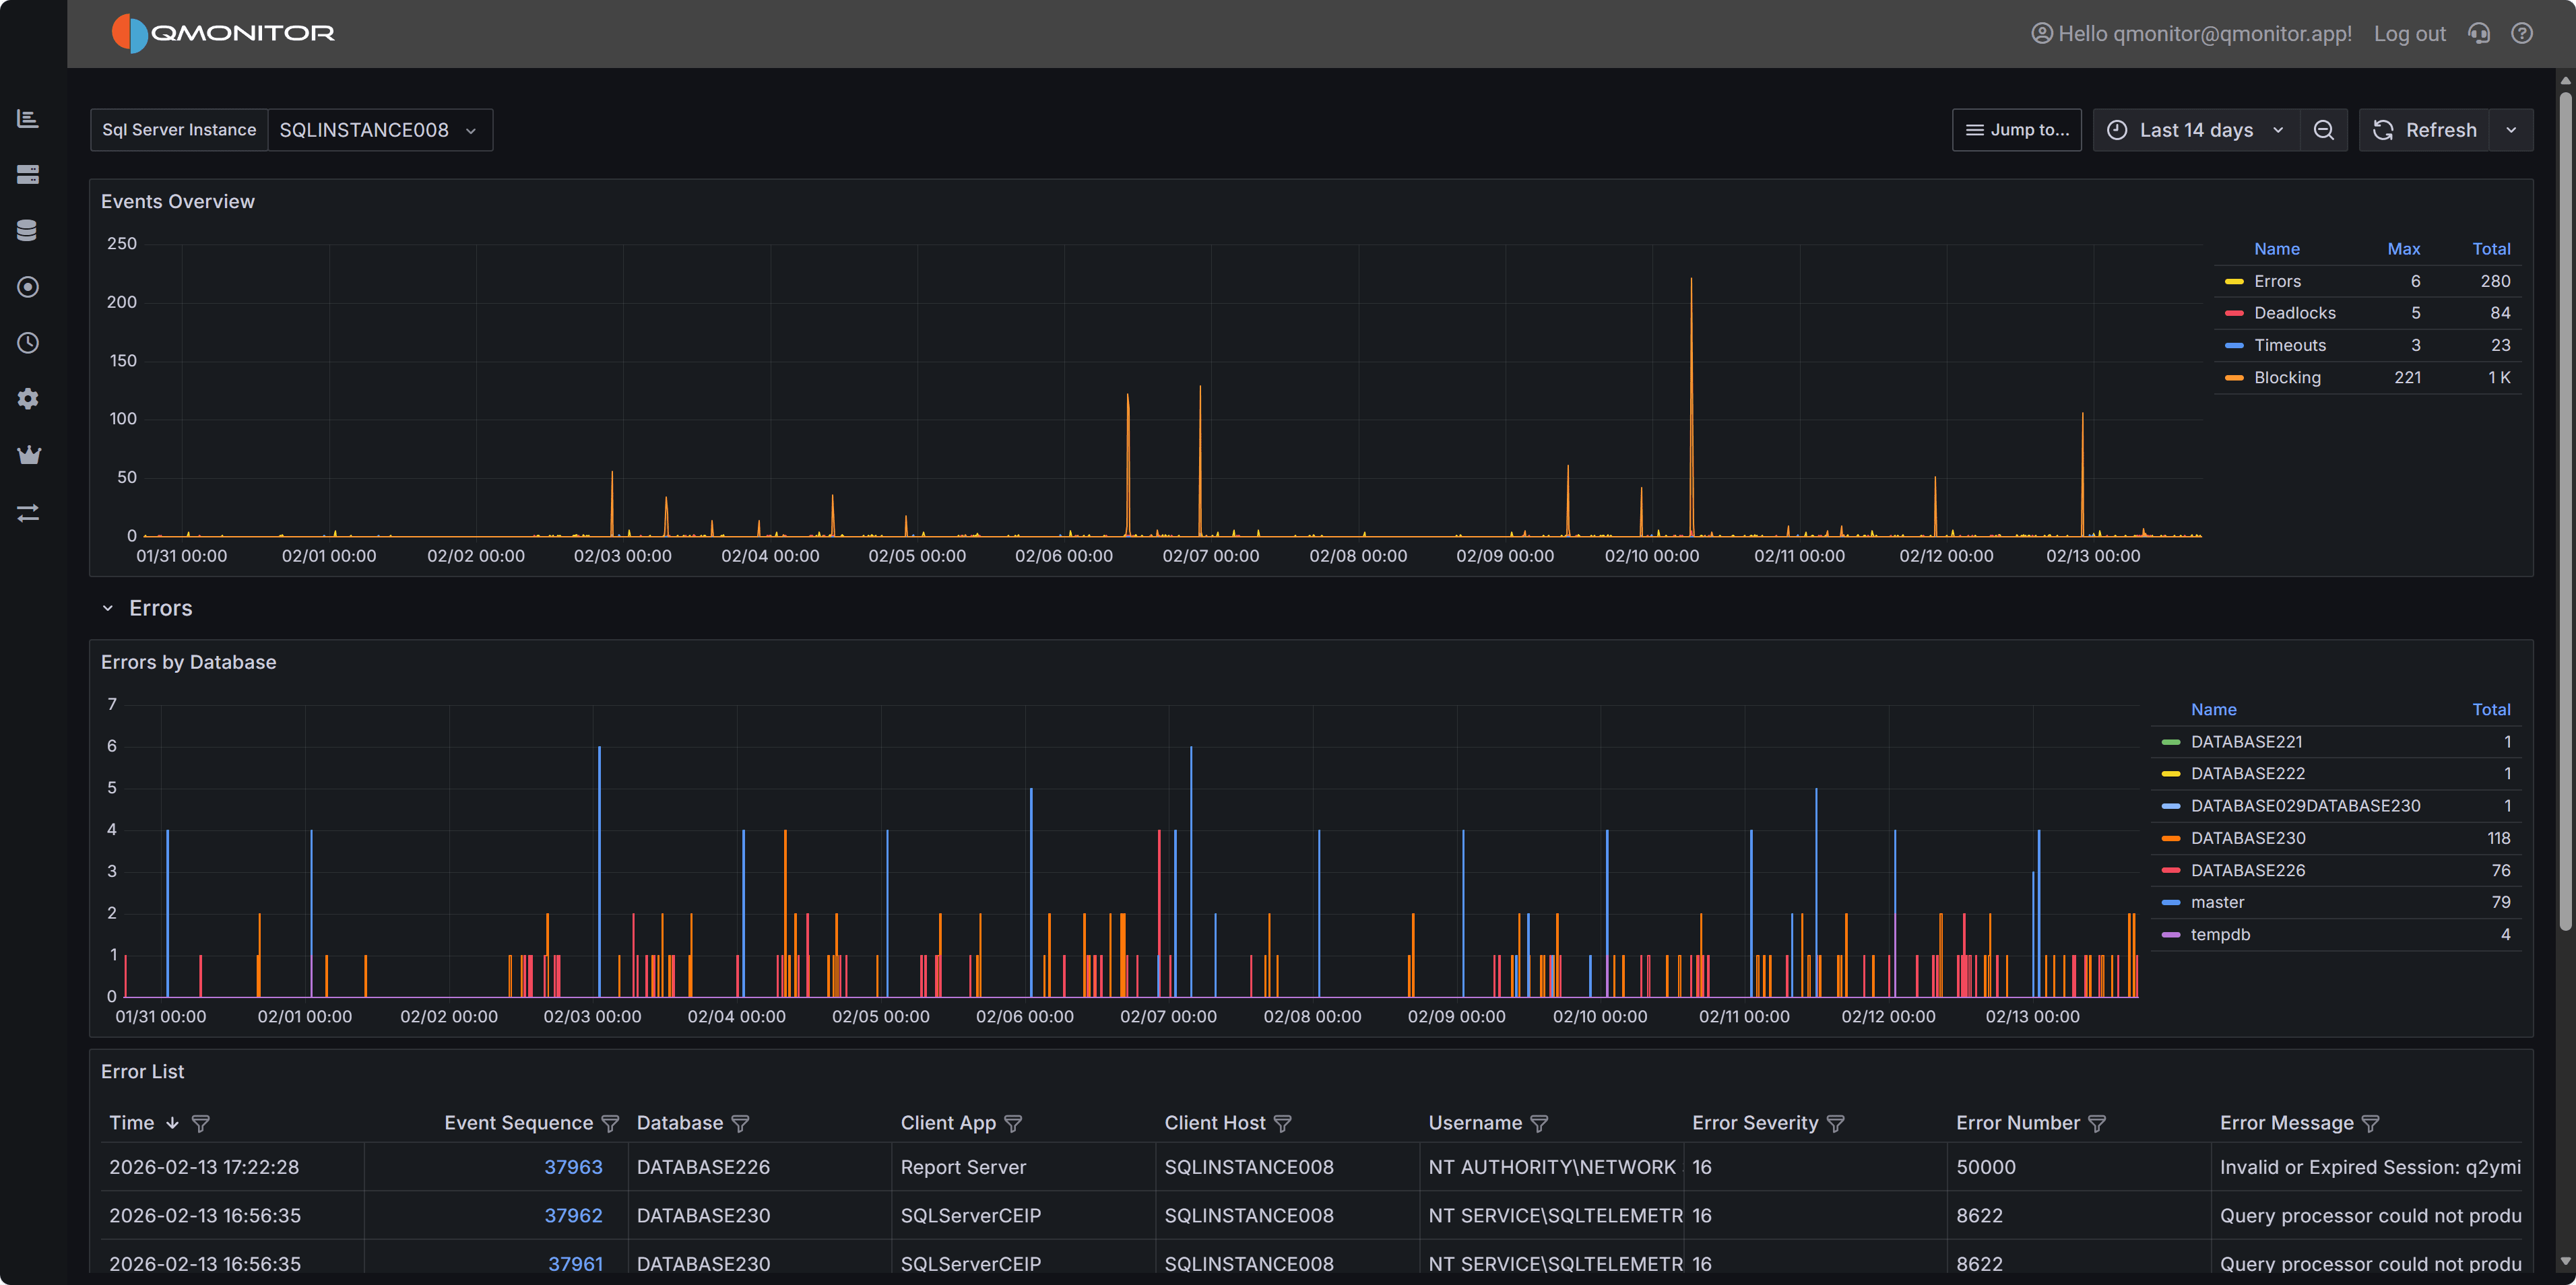 SQL Server Events dashboard showing events by type
The top chart breaks events down by type:
- Errors
- Deadlocks
- Blocking
- Timeouts
Expand a row to view a chart for that event type by database and a list of
individual events. Click a row’s hyperlink to open a detailed dashboard for
that event type, where you can inspect the event details.
1 - Errors
Details about errors occurring on the instance
The Errors dashboard helps you monitor and diagnose SQL Server errors that may indicate application
issues, security problems, or infrastructure failures. By tracking error patterns over time and
analyzing error details, you can proactively identify and resolve problems before they impact users.
Expand the “Errors” row to see a chart that shows the number of errors per database over time.
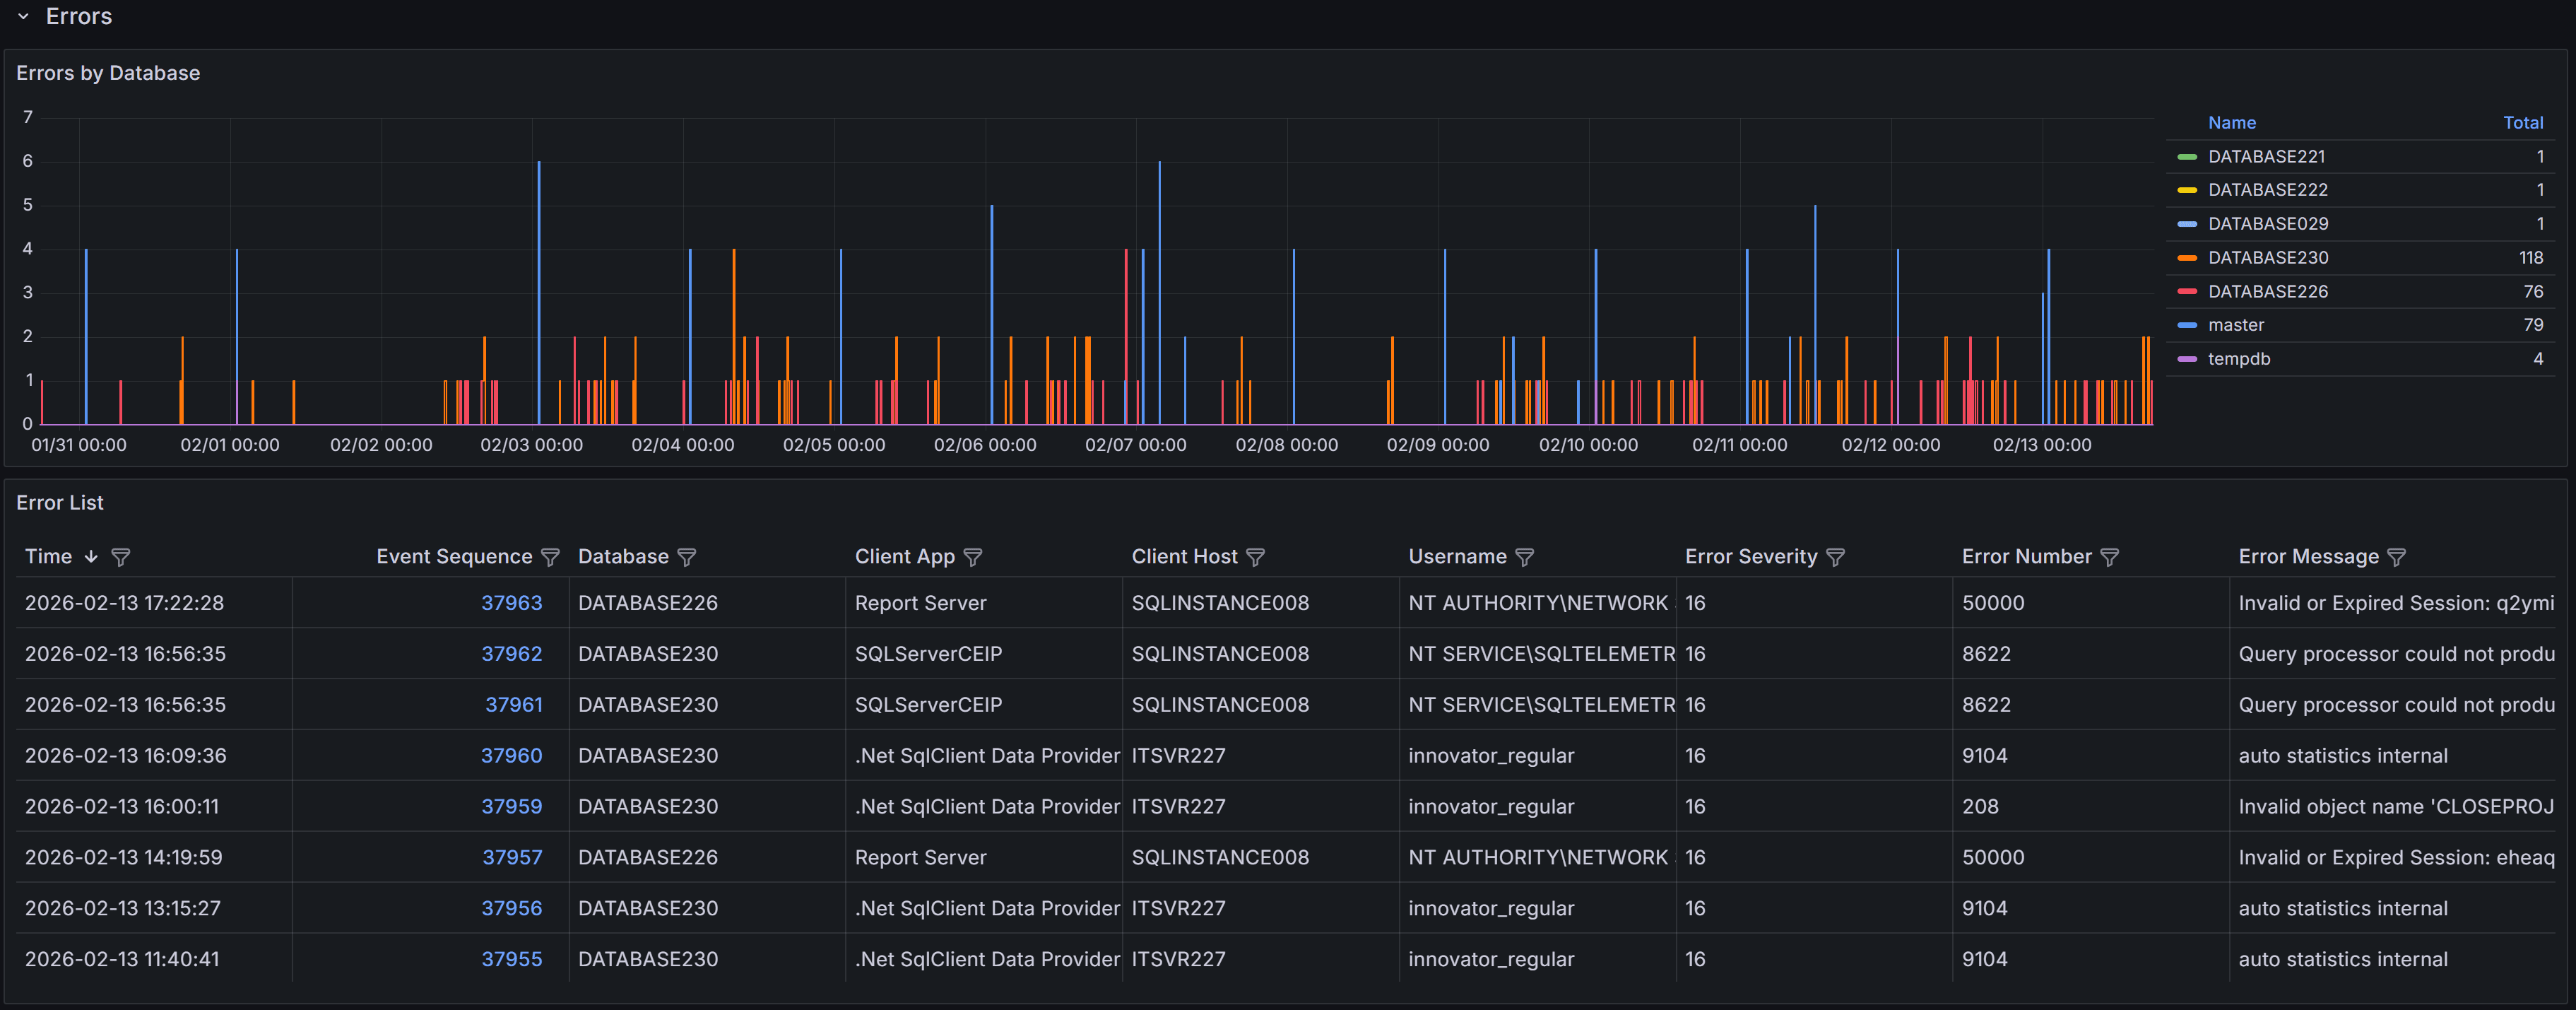 Errors by database
Below the chart, a table lists individual error events with these columns:
- Time: the time the error occurred
- Event sequence: a unique identifier for the error event
- Database: Name of the database where the error occurred
- Client App: Name of the client application that caused the error
- Client Host: Name of the client host that originated the error
- Username: Login name of the connection where the error occurred
- Error Severity: the severity level of the error, on a scale from 16 to 25
- Error Number: the error number, which identifies the type of error
- Error Message: a brief description of the error
SQL Server error severity levels range from 0 to 25. This dashboard displays only errors with
severity 16 or higher, which represent user-correctable errors and system-level problems. Severity
16-19 errors are typically application or query errors that users can fix. Severity 20-25 errors
indicate serious system problems that may require DBA intervention. Understanding severity helps you
prioritize which errors need immediate attention.
Note
Error 17830 (“Network error code 0x2746 occurred while establishing a connection”) is excluded from
this view because it can occur very frequently during normal connection pooling and retry logic,
creating noise that obscures more actionable errors.Tip
Use the filter controls in the column headers to filter the table. Click a column header to
sort by that column: each click cycles through ascending, descending, and no sort.Error Details
Click the link in the Event Sequence column to open the error details dashboard.
It shows the full error message and, when available, the SQL statement that caused the error.
The SQL text may be unavailable for some error types.
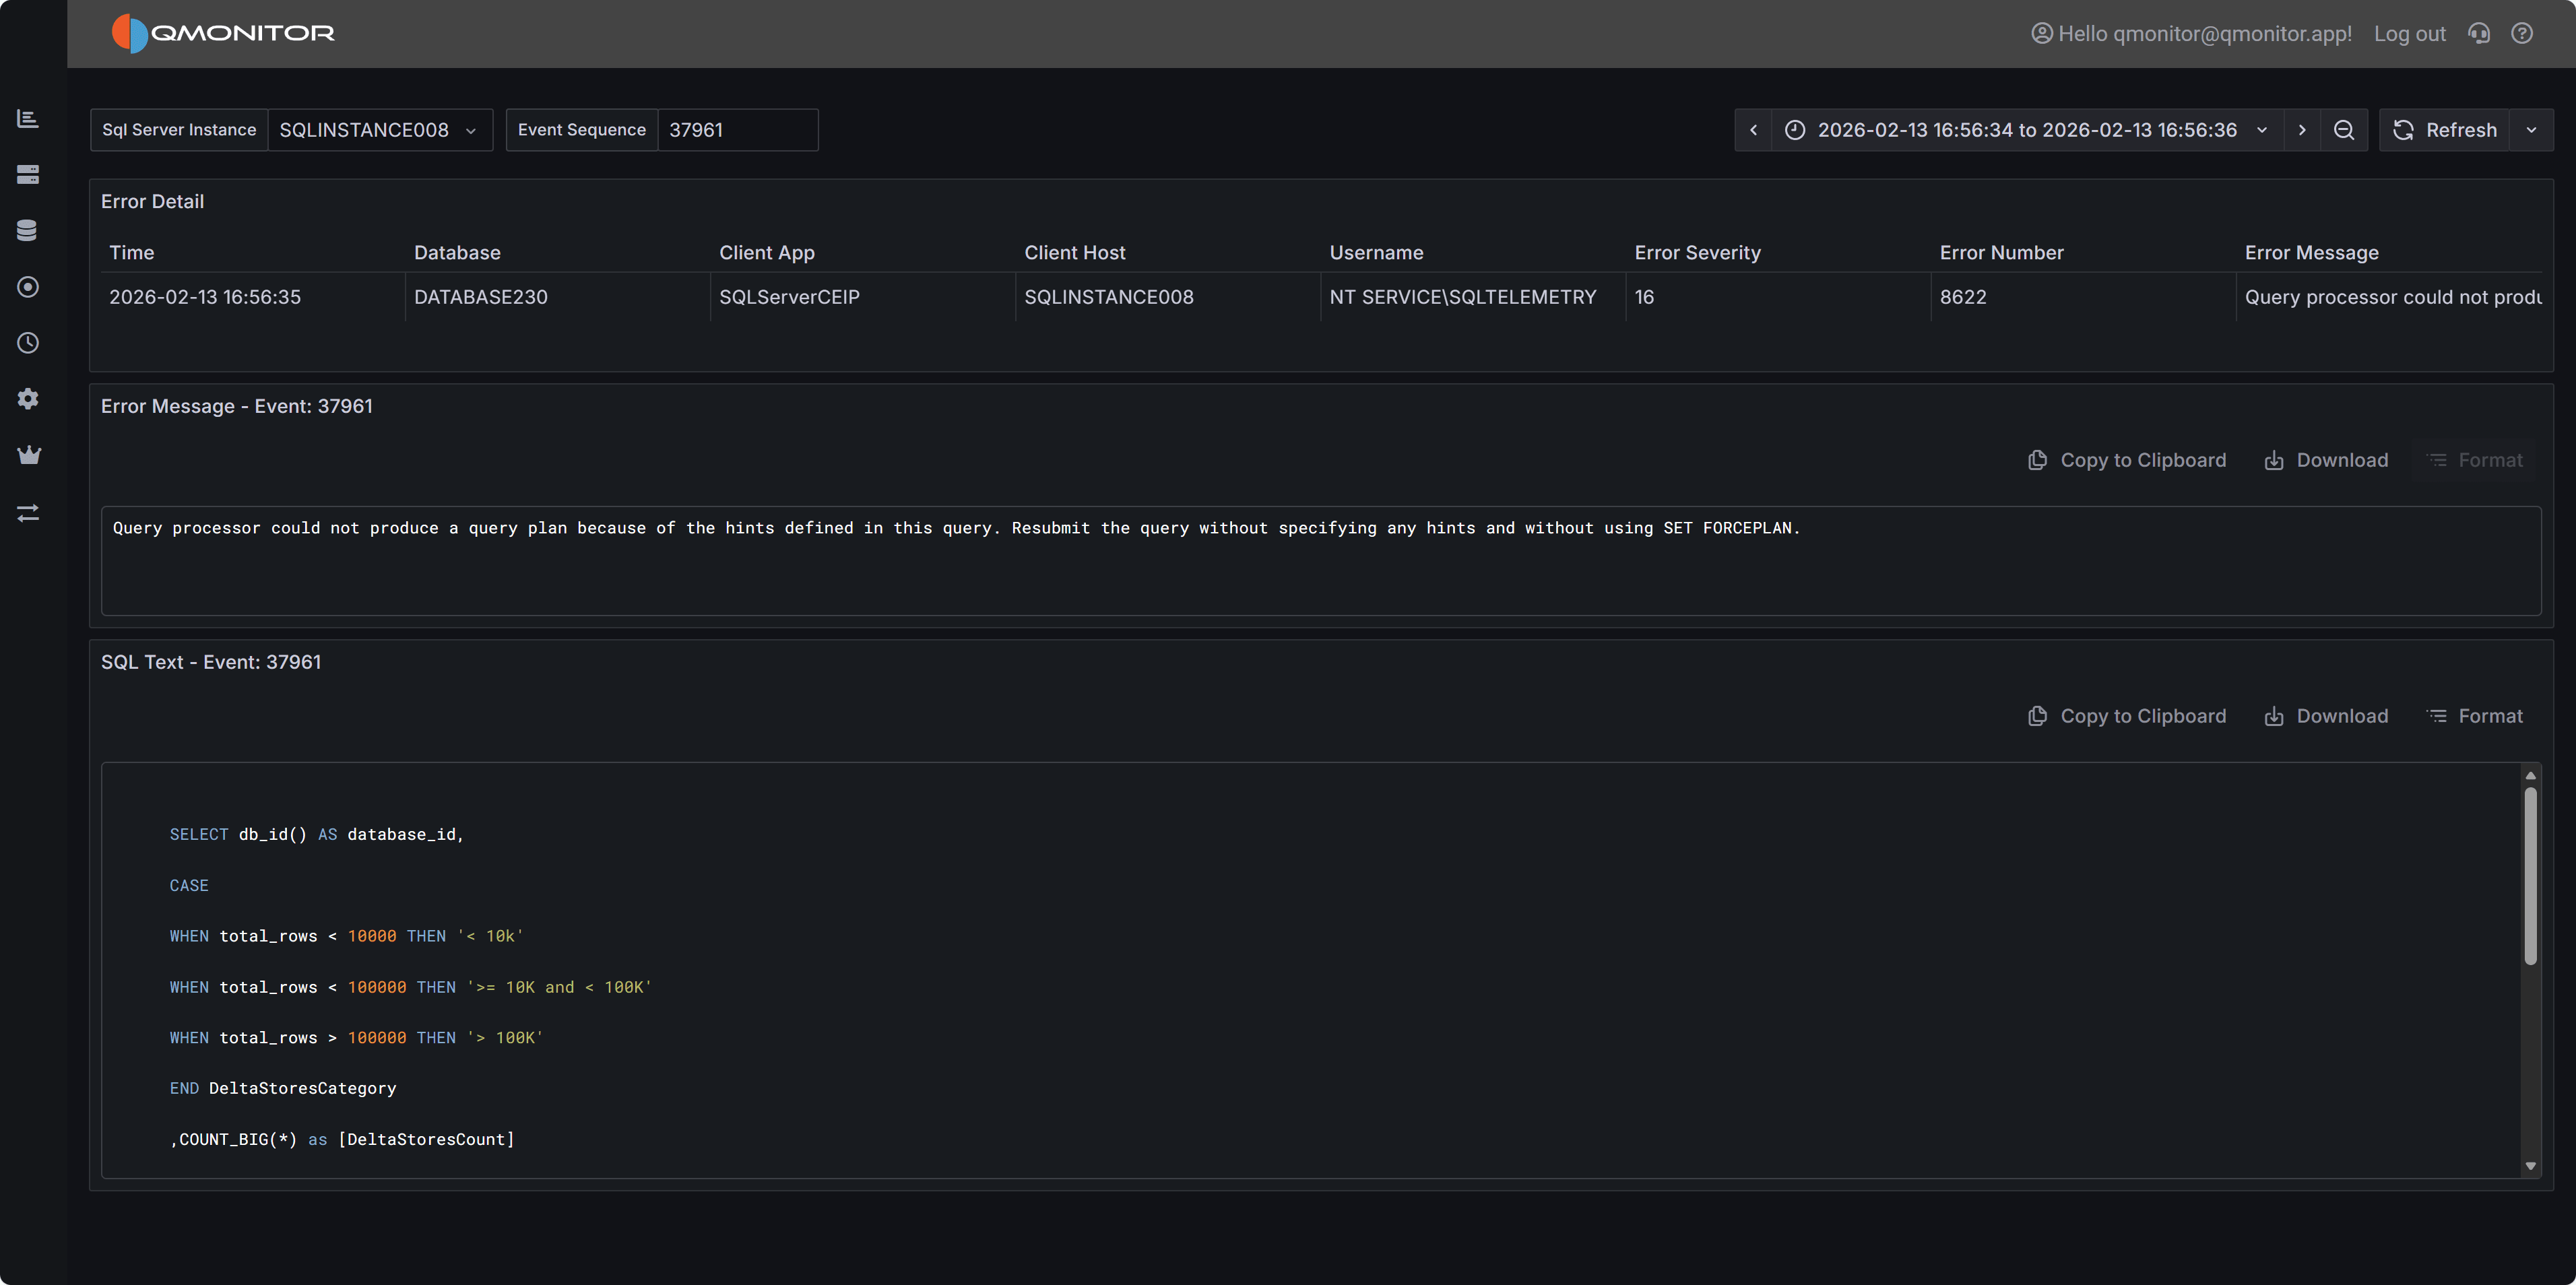 Error Details
Common Error Patterns to Investigate
When analyzing errors, watch for these common patterns:
Permission Errors (229, 297, 300, 15247) - Users attempting operations they don’t have rights to perform.
Review permissions and ensure applications are using appropriate service accounts.
Connection Errors (18456) - Failed login attempts. May indicate incorrect credentials, expired
passwords, or potential security issues.
Object Not Found (207, 208) - Queries referencing columns, tables, views, or procedures that don’t exist. Often
occurs after deployments or when applications use wrong database contexts.
A complete list of SQL Server error numbers and their meanings can be found in the official documentation:
Using the Errors Dashboard Effectively
Start by filtering the time range to focus on recent errors or specific time periods when users
reported issues. Use the database filter to focus on specific databases if you’re responsible for
particular applications.
Filter by Error Number to display similar errors together. Grouping by error number helps you
identify whether a single issue is affecting multiple users or databases.
When you find patterns of repeated errors, click through to the error details to examine the full
error message and SQL statement. The SQL text often reveals the specific query or operation causing
problems, allowing you to identify whether the issue is in application code, database schema, or
data quality.
Monitor error trends over time by comparing different time periods. Increasing error rates may
indicate degrading application quality, growing data volumes causing queries to fail, or infrastructure
issues affecting database connectivity.
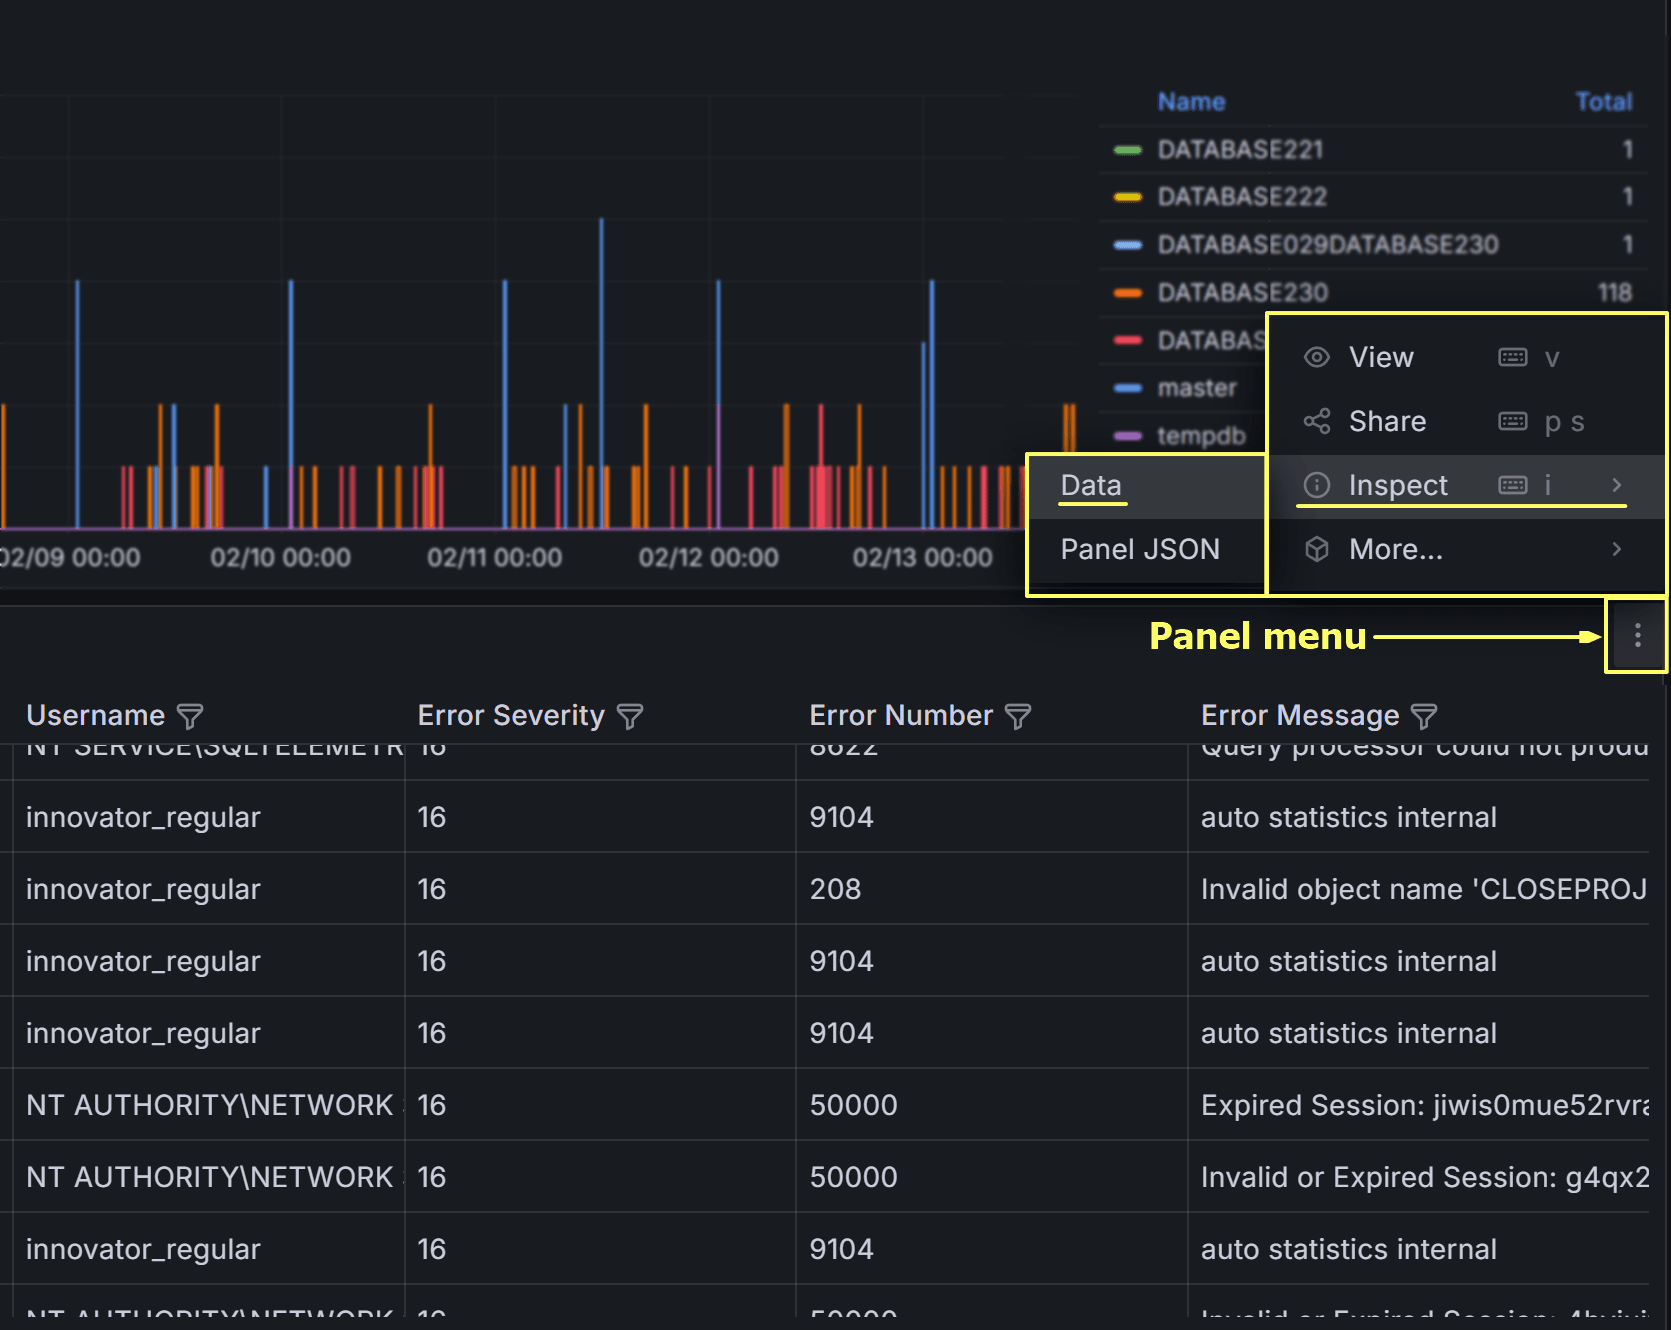
Exporting Error Events
You can export the error events table to CSV for offline analysis or sharing with development teams.
Click on the three-dot menu in the table header and select Inspect –> Data to download the data in CSV format.
On the next dialog, make sure to check all three switches to download a result set that resembles the
table view in the dashboard as closely as possible, including all columns and filters.
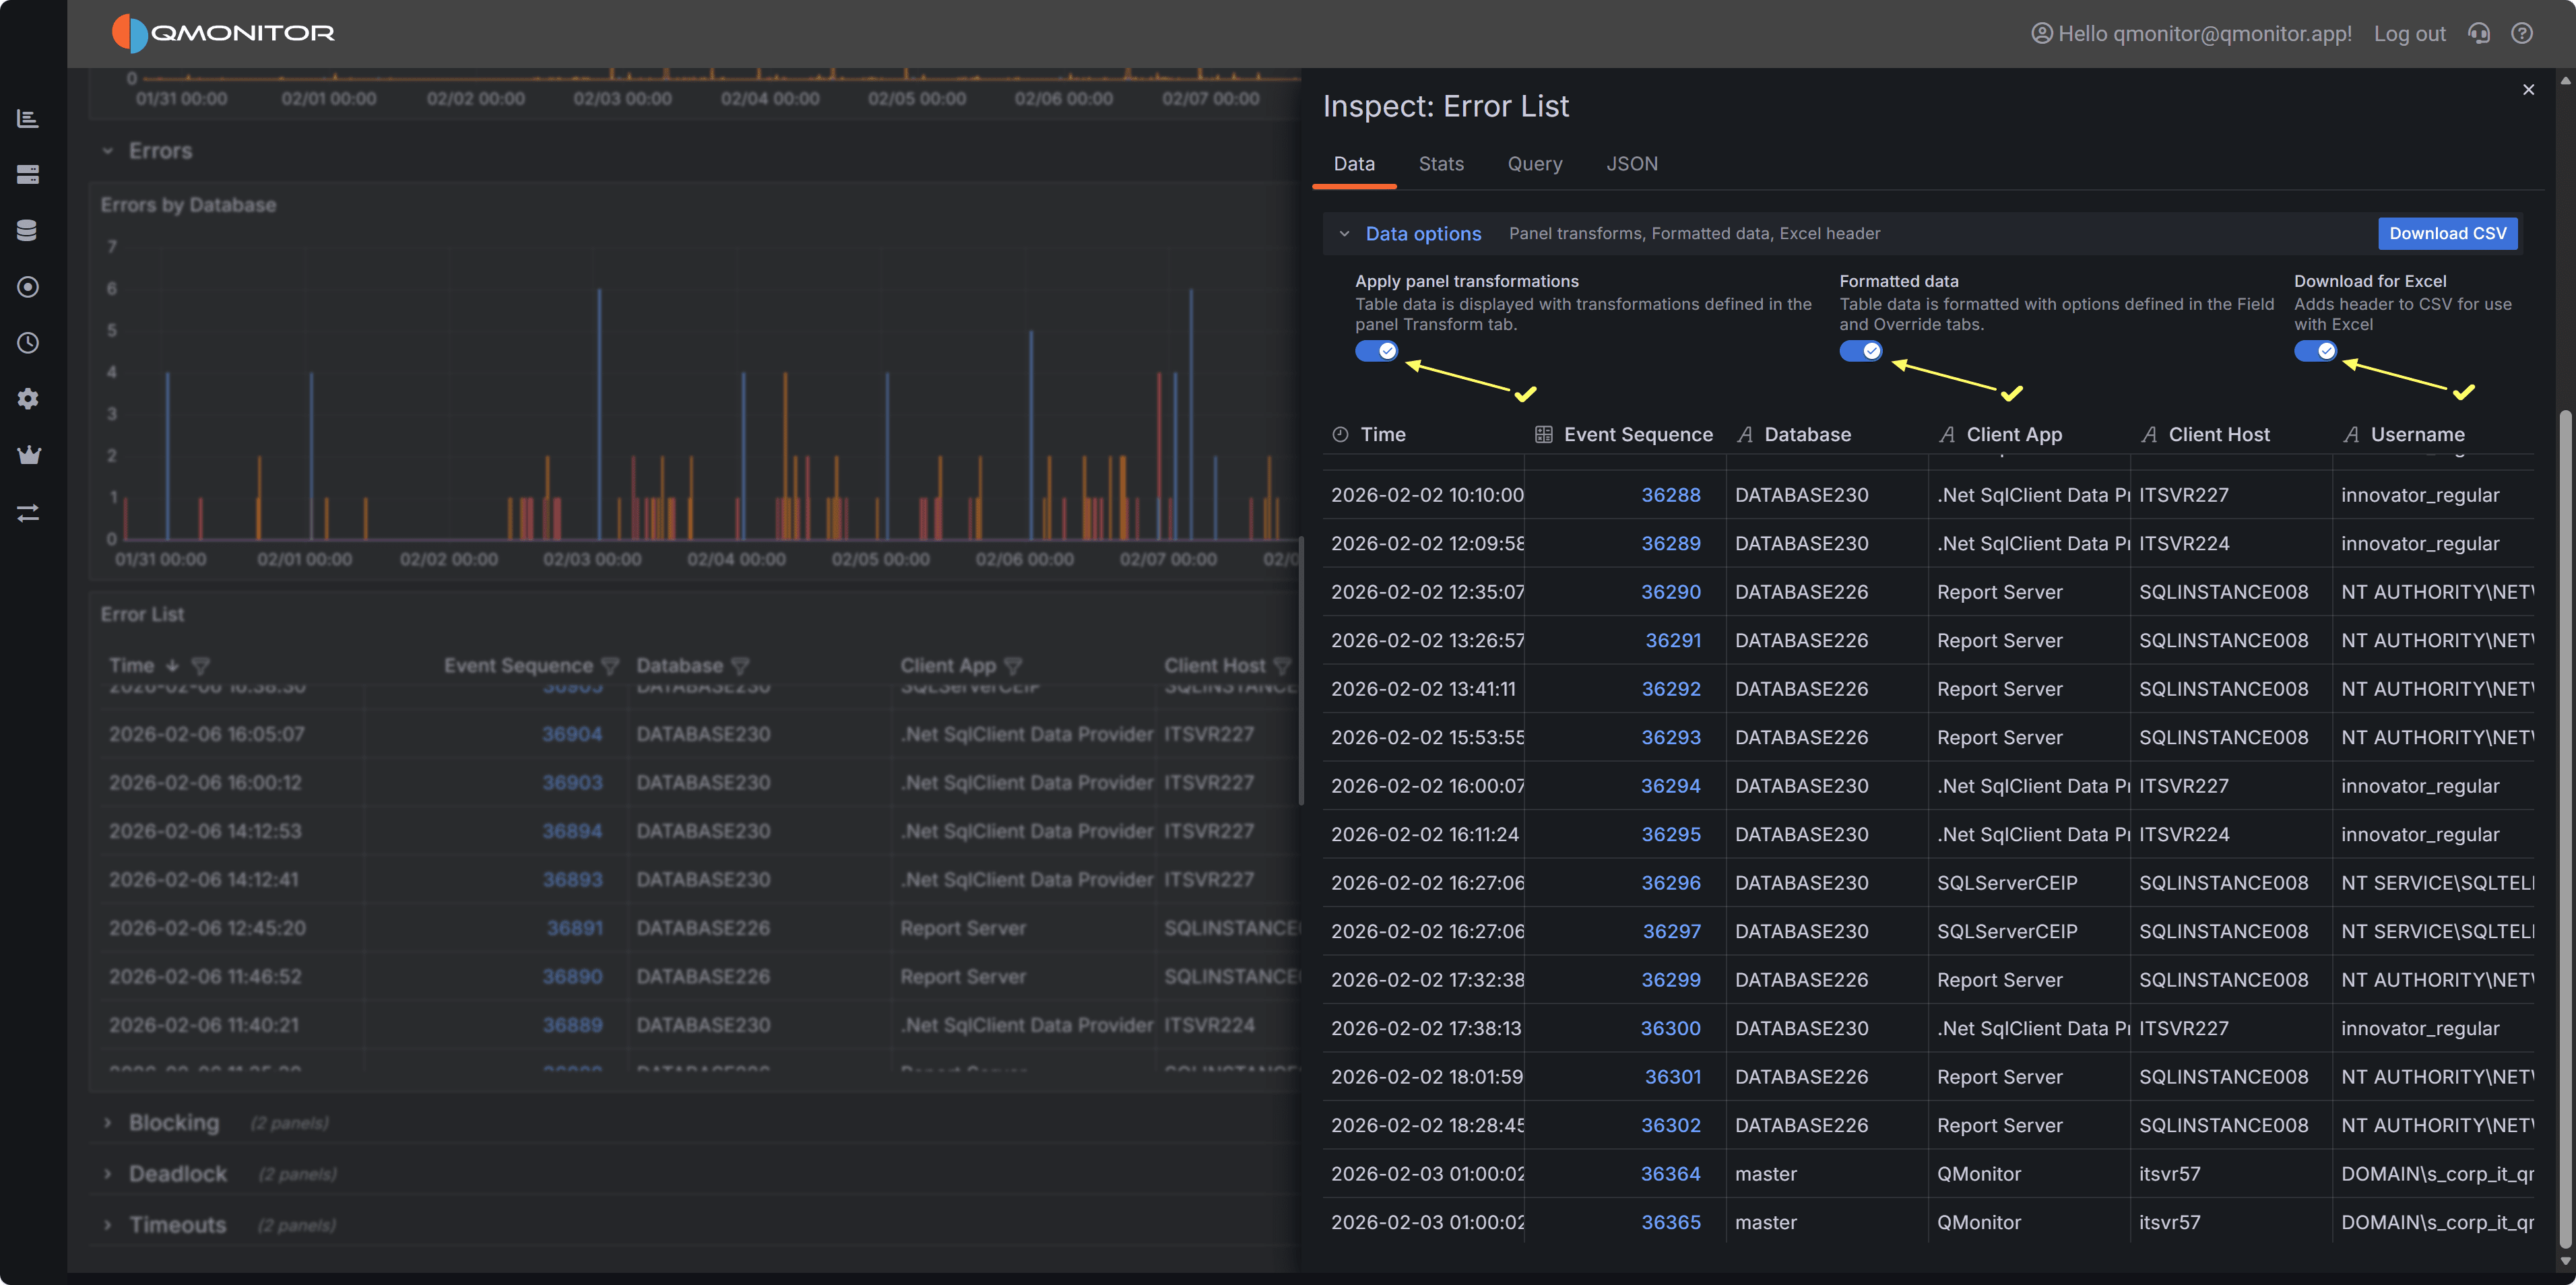
Click Download CSV to export the data. You can then open the CSV file in Excel or other tools for further analysis,
such as pivoting by error number or database to identify common issues.
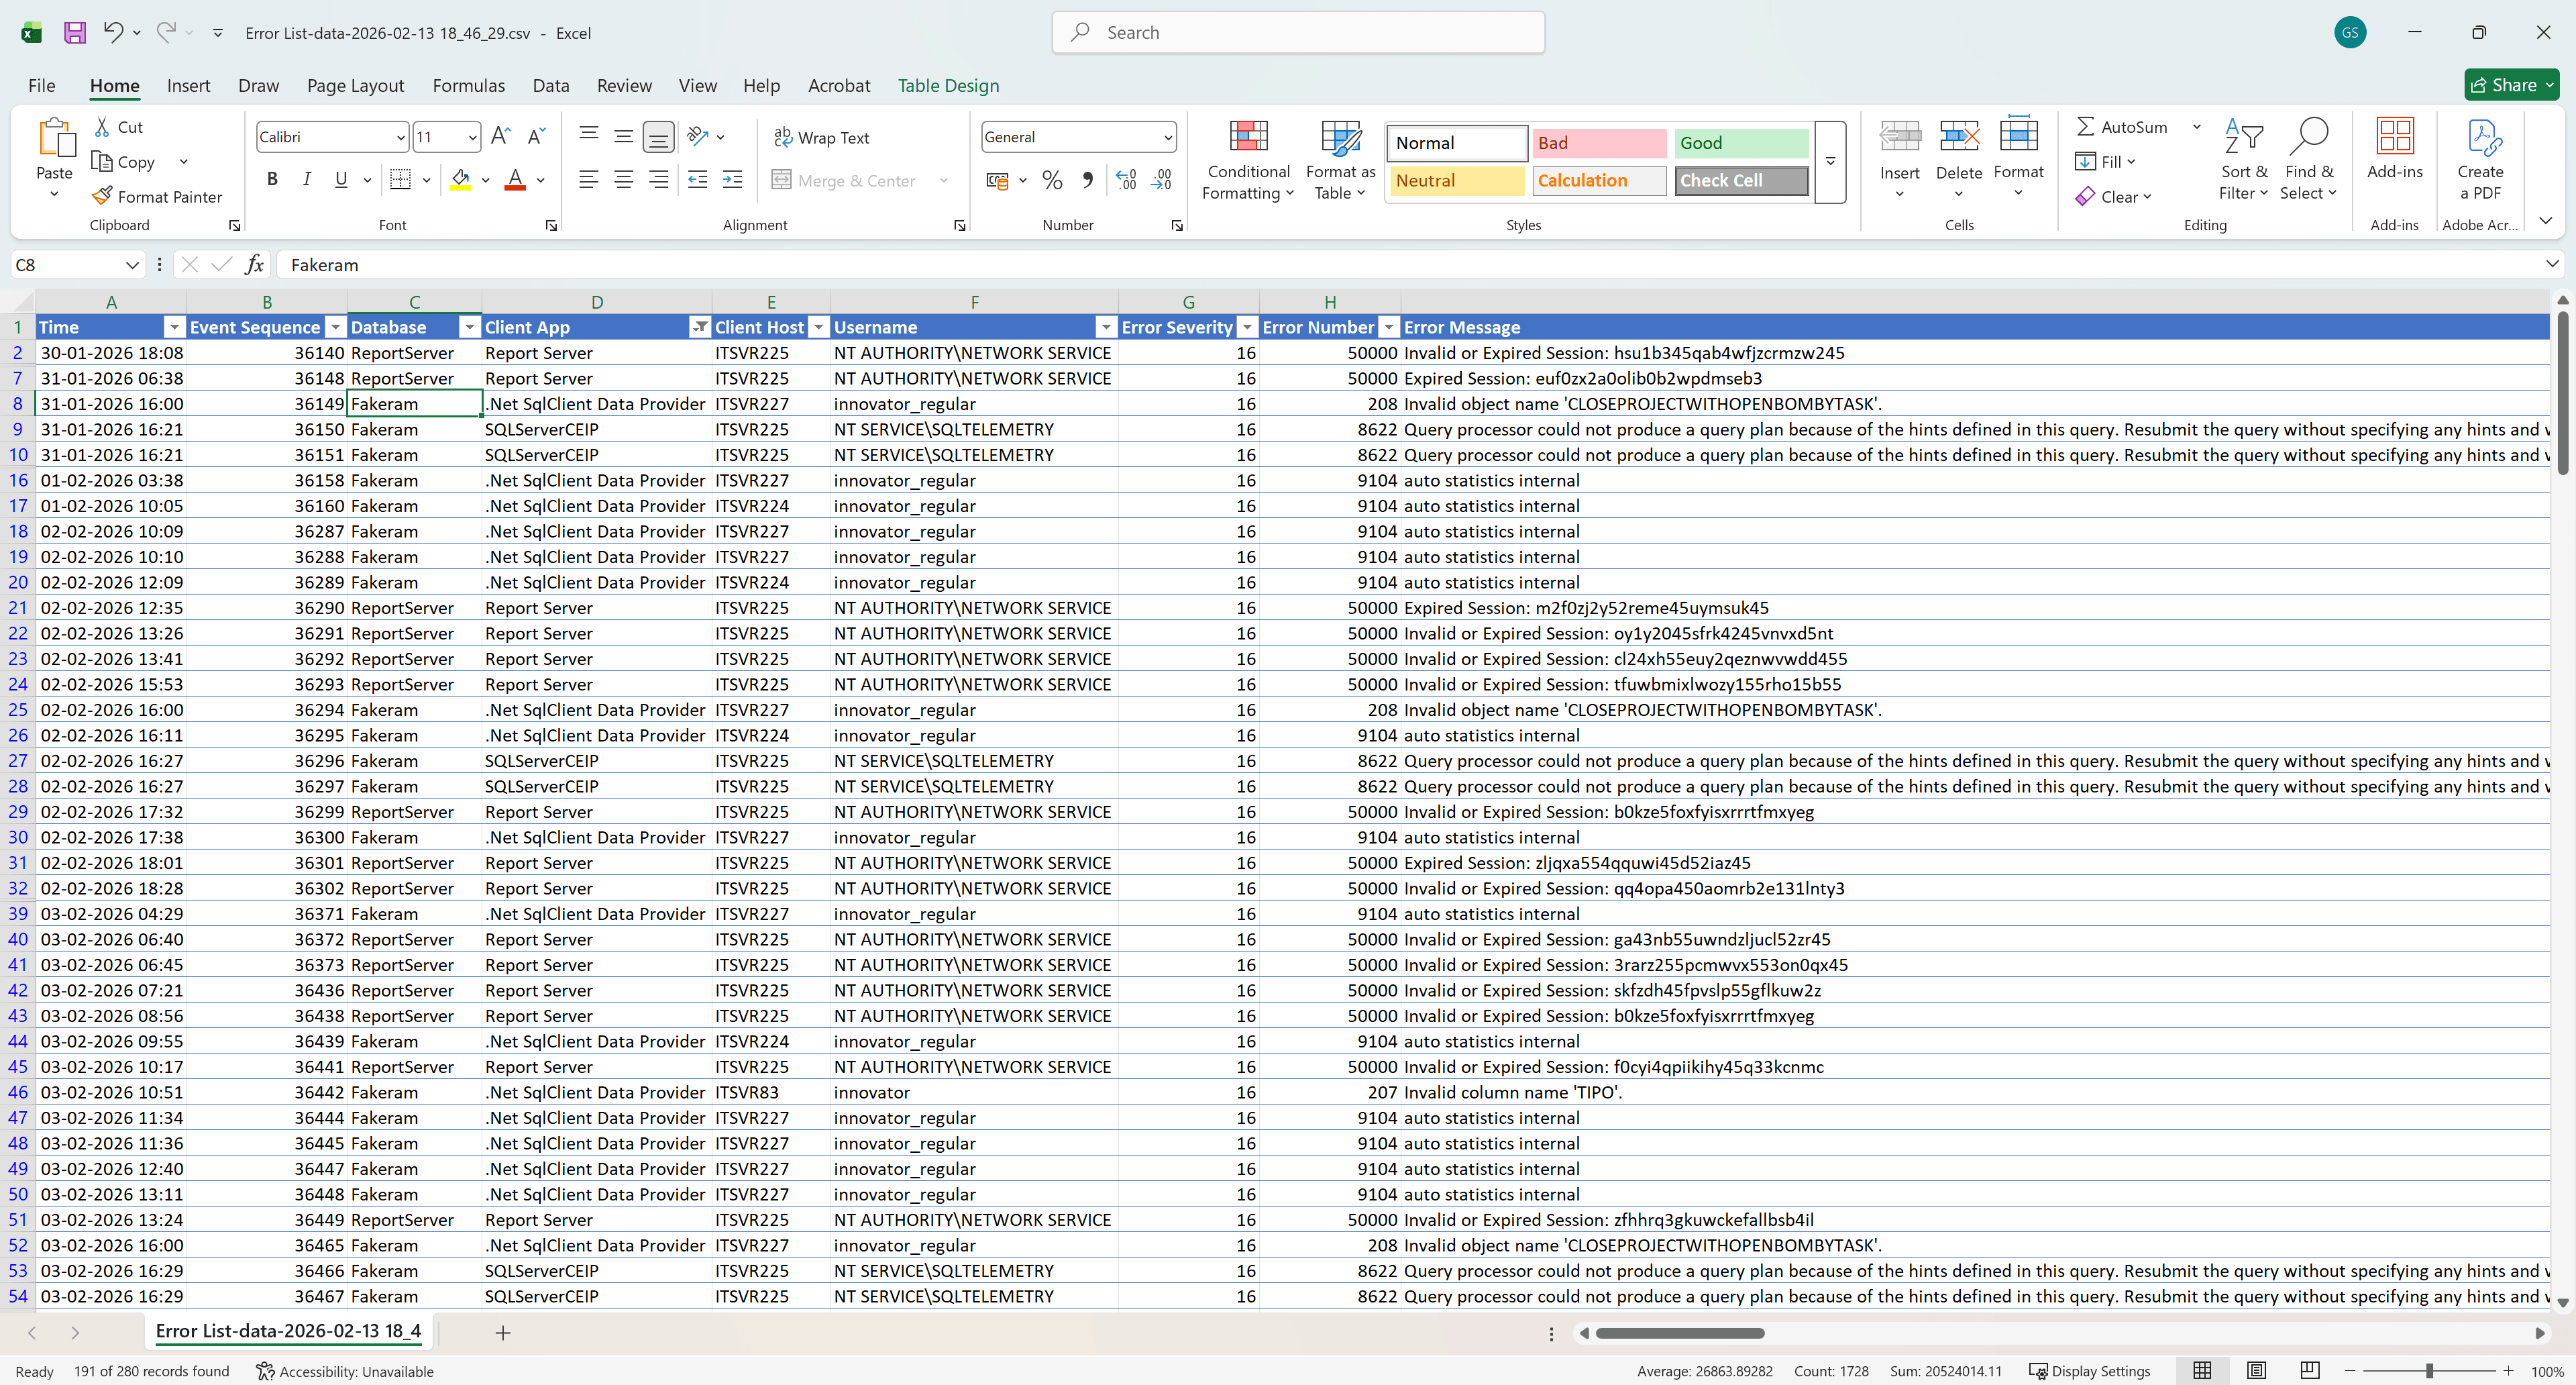
This is what the exported CSV file looks like when opened in Excel, with all columns and filters applied:
2 - Blocking
Blocking Events
The Blocking dashboard helps you identify and diagnose sessions that are waiting for locks held by
other sessions.
Important
Blocking occurs when one transaction holds a lock on a resource that another transaction needs to access,
causing the second transaction to wait. While some blocking is normal in multi-user database systems,
excessive or prolonged blocking can severely impact application performance and user experience.Understanding blocking patterns helps you identify problematic
queries, optimize transaction design, and improve concurrency.
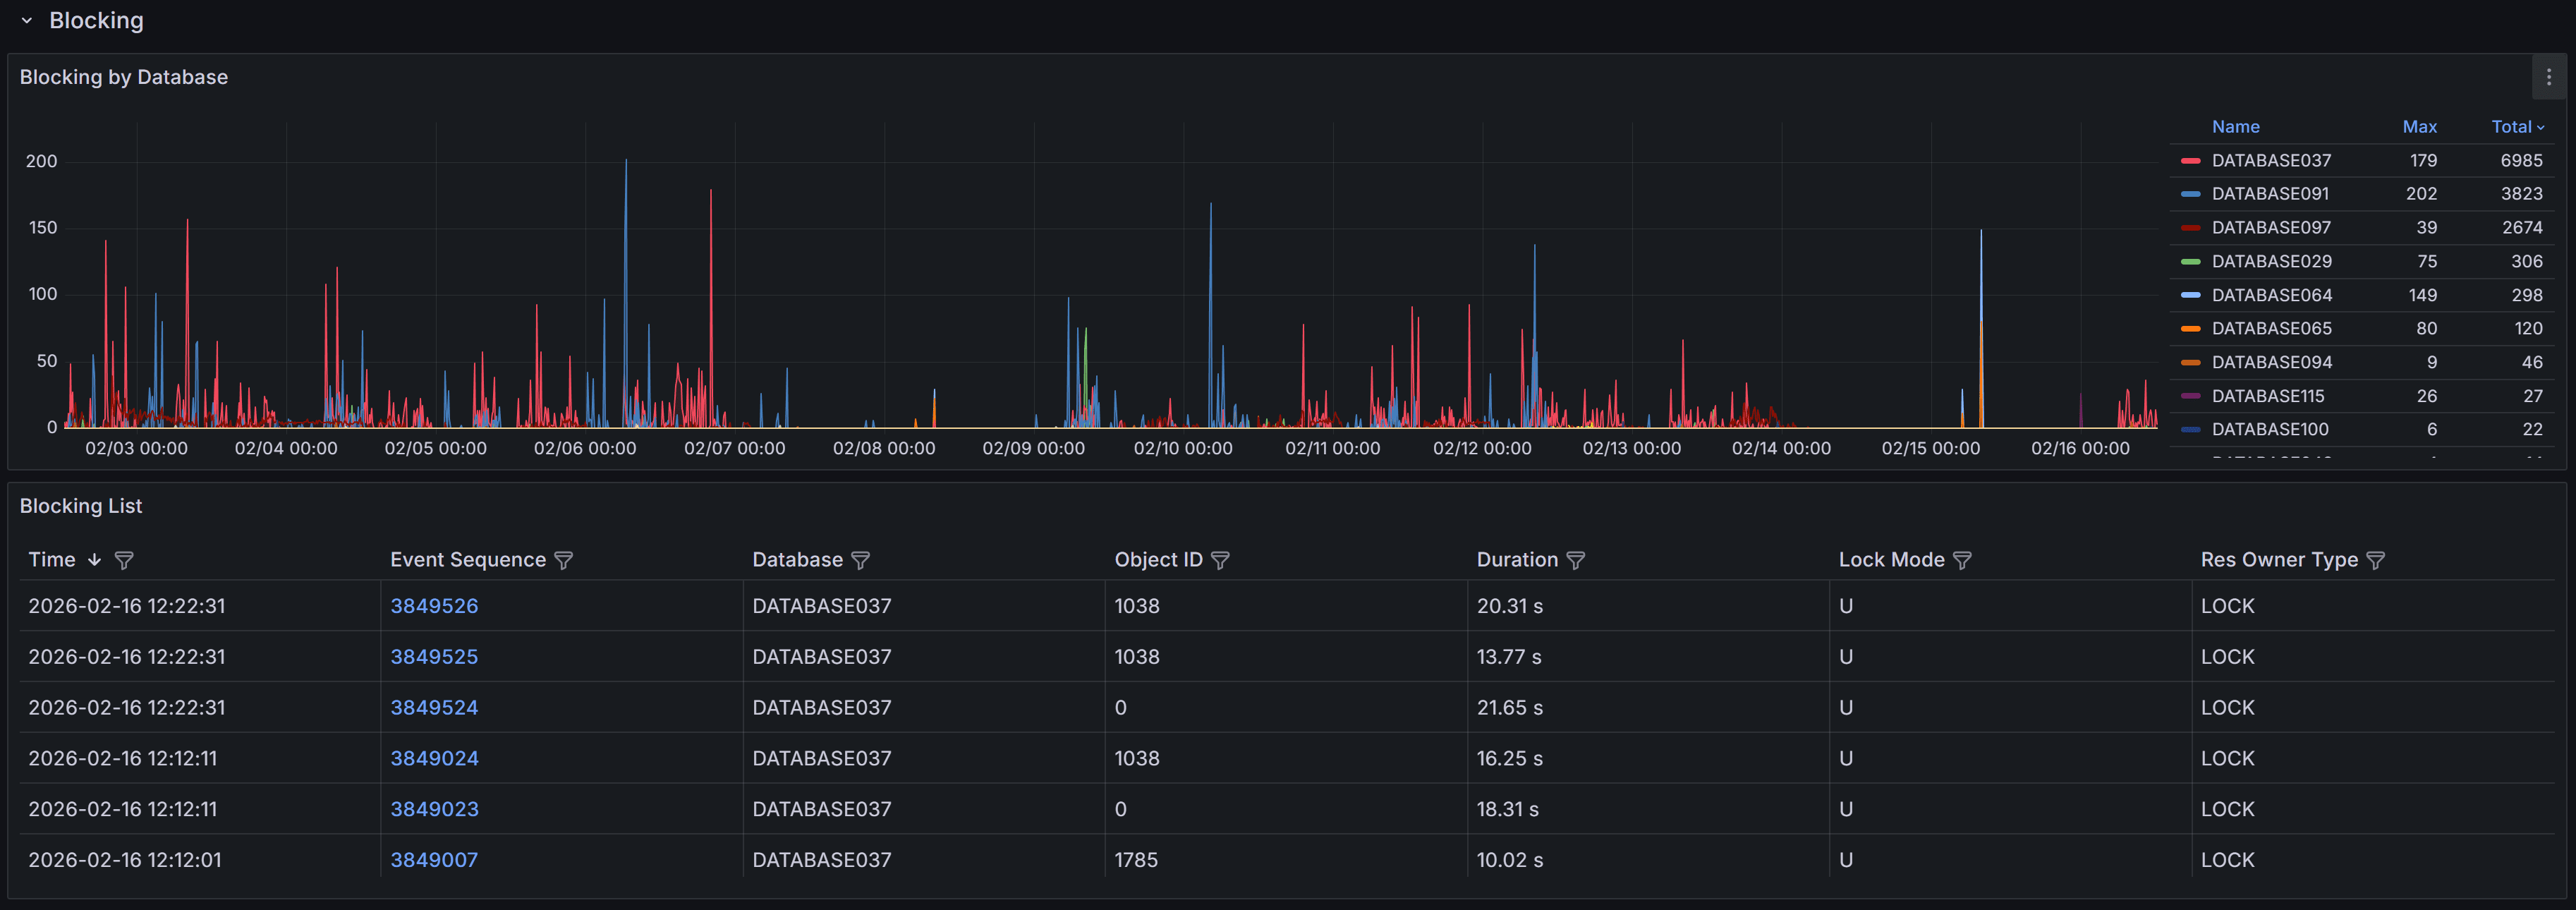
Expand the “Blocking” row to view a chart that shows the number of blocking events
for each database.
SQL Server generates blocked process events only when a session waits on a lock longer than the configured
blocked process threshold. By default, this threshold is set to 0 seconds, which means SQL Server
does not generate blocking events at all.
Tip
The QMonitor setup script configures the blocked process threshold to 10 seconds as a recommended starting
point. If you see too many blocking events for brief waits that don’t cause problems, increase the threshold
to 15-20 seconds. After resolving most major blocking issues, lower it to 5 seconds to catch emerging problems
early.The blocking events table below the chart provides detailed information about each blocking occurrence:
- Time shows when the blocking event was captured, helping you correlate blocking with other
activities like batch jobs or peak usage periods.
- Event Sequence provides a unique identifier for the blocking event that you can reference when
investigating or communicating with team members.
- Database identifies which database the blocking occurred in, helping you route investigation to
the appropriate database owners.
- Object ID indicates the specific table or index involved in the lock, useful for identifying
which database objects are causing contention.
- Duration displays how long the blocked session waited before the event was captured. Note that
this is the wait time at the moment of capture; if blocking continued, the actual total wait time
may be longer.
- Lock Mode shows the type of lock the blocking session holds (e.g., Exclusive, Shared, Update).
Understanding lock modes helps you identify whether blocking is caused by writes blocking reads,
writes blocking writes, or other lock compatibility issues.
- Resource Owner Type indicates what type of resource is being locked, such as a row, page, table,
or database.
Use the column filters and sort controls to filter and sort the table.
Click a row to open the Blocking detail dashboard.
Blocking Event Details
When you click on a blocking event in the main table, the Blocking Detail dashboard opens with
comprehensive information to help you diagnose the root cause.
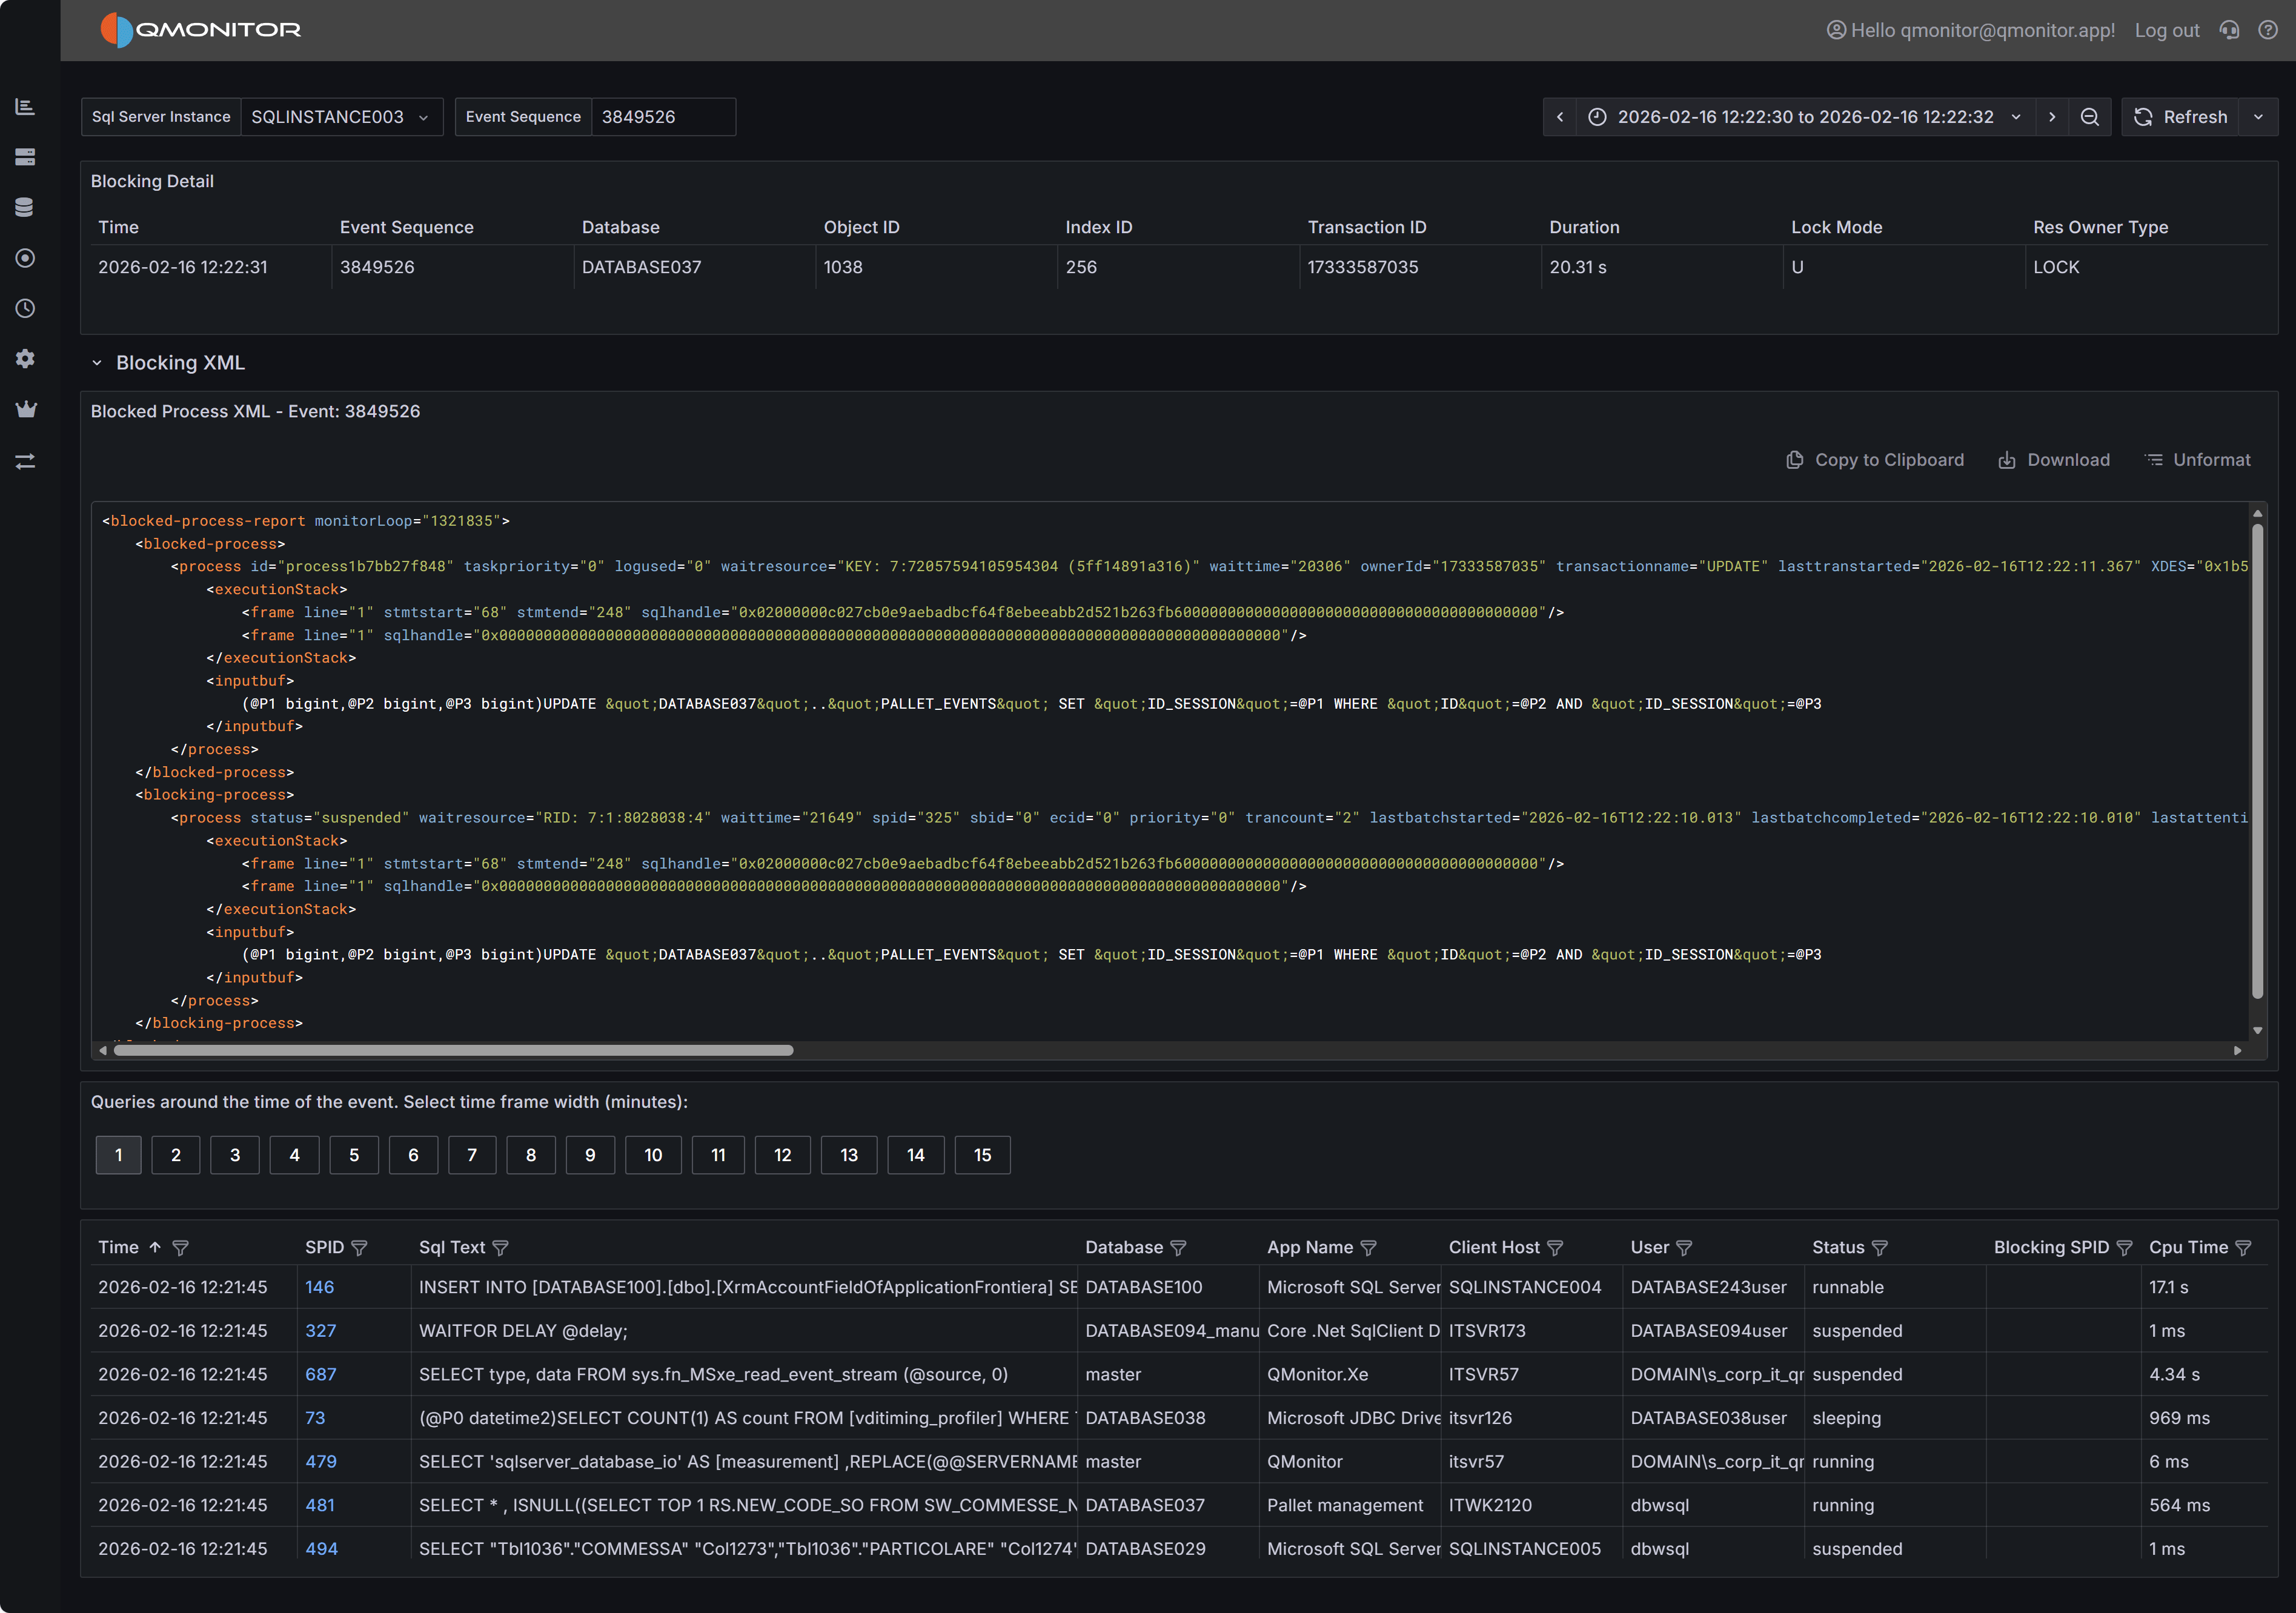 Blocking event detail showing blocked and blocking processes
Event Summary
The top table provides key information about both the blocked and blocking processes. You’ll see the
session IDs (SPIDs) of the blocked and blocking sessions, how long the blocking lasted, which database
and object were involved, the lock mode causing the block, and the resource owner type. This summary
gives you immediate context about what was blocked, what was blocking it, and how serious the impact was.
Blocked Process Report XML
The Blocked Process Report XML panel displays the complete XML report generated by SQL Server when the
blocking event occurred. This XML contains detailed information about both the blocked and blocking
sessions, including the SQL statements they were executing, their transaction isolation levels, and
the specific resources they were waiting for or holding.
The XML includes one or more <blocked-process> nodes describing sessions that were waiting, and one
or more <blocking-process> nodes describing sessions that held the locks. Each node contains attributes
and child elements that provide:
- The SQL statement being executed (in the
inputbuf element). This might be truncated if the statement is very long. - The transaction isolation level
- Lock resource details (database ID, object ID, index ID, and the specific row or page being locked)
- The login name and host name of the session
- The current wait type and wait time
While the complete XML schema is documented in Microsoft’s SQL Server documentation, the most immediately
useful information is typically the SQL text from both the blocked and blocking processes. Documenting
the complete XML structure is beyond the scope of this documentation.
Active Sessions Grid
The bottom grid lists all sessions that were active around the time the blocking event occurred. This
context is valuable because blocking chains often involve multiple sessions, and understanding the
overall session activity helps you identify patterns and root causes.
Use the time window buttons above the grid to adjust how far before and after the blocking event you
want to see session data. Options range from 1 minute to 15 minutes. A wider window provides more
context but may include unrelated sessions.
Tip
Filter the grid by the “Blocking or Blocked” column set to “1” to see only sessions that were
either blocking another session or being blocked. This focused view helps you quickly identify
all participants in blocking chains without displaying unrelated active sessions.3 - Deadlocks
Information on deadlocks
The Deadlocks dashboard helps you identify and diagnose deadlock situations.
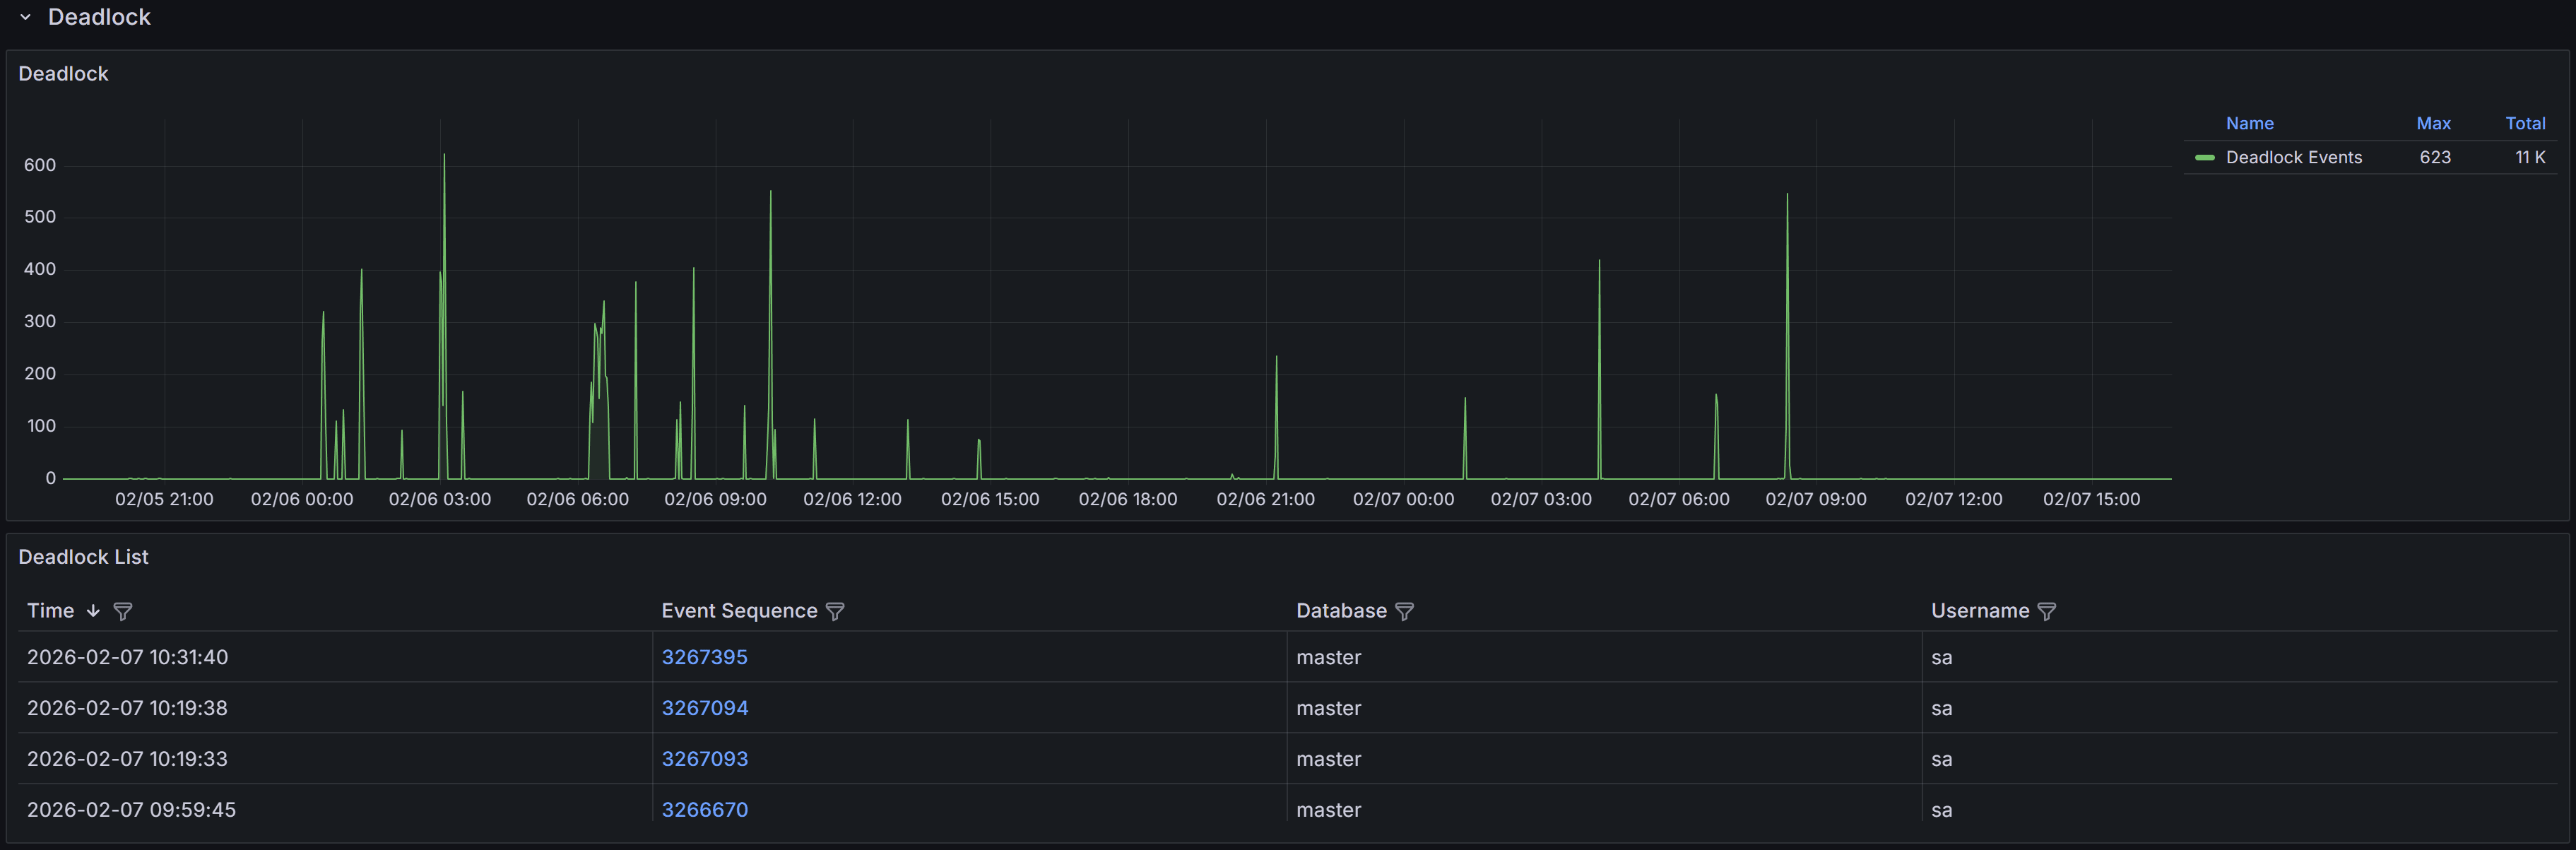
Expand the “Deadlocks” row to view a chart that shows the number of deadlocks
for each database.
Understanding Deadlocks
A deadlock occurs when two or more sessions create a circular dependency on locks.
Example
Session 1 updates Table A and then tries to update Table B, while Session 2 updates Table B and then
tries to update Table A. If both sessions start at nearly the same time, Session 1 will hold a lock on
Table A while waiting for Table B, and Session 2 will hold a lock on Table B while waiting for Table A.
Neither can proceed, creating a deadlock.SQL Server’s deadlock detector runs every few seconds to identify these circular lock dependencies. When
a deadlock is detected, SQL Server analyzes the sessions involved and chooses one as the “deadlock victim”
based on factors like transaction cost and deadlock priority. The victim’s current statement is rolled
back with error 1205, while other sessions proceed normally. The application that receives error 1205
should catch this error and retry the transaction, as the same operation will typically succeed on retry
once the competing transaction completes.
QMonitor captures deadlock events through SQL Server extended events and stores the complete deadlock
graph as XML. This graph contains detailed information about all sessions involved in the deadlock, the
resources they were competing for, and the SQL statements they were executing at the time.
The deadlock events table below the chart lists all captured deadlocks with the following information:
- Time shows when the deadlock occurred, helping you identify patterns such as deadlocks during batch
processing or peak usage periods.
- Event Sequence provides a unique identifier for the deadlock event that you can use when
communicating with team members or referencing in tickets.
- Database identifies which database the deadlock occurred in, helping you route investigation to the
appropriate database owners and application teams. This is often reported as “master”,
- but the graph itself contains the actual database context for each session.
- User Name shows the SQL Server login involved in the deadlock, useful for identifying which
applications or users are experiencing deadlock issues.
Use the column filters to narrow the list to specific databases or time periods, and sort by Time to see
the most recent deadlocks first or to identify clusters of deadlocks occurring in quick succession.
Click a row to open the Deadlock detail dashboard.
Deadlock Event Details
When you click on a deadlock event in the main table, the Deadlock Detail dashboard opens with
comprehensive information to help you understand and resolve the deadlock.
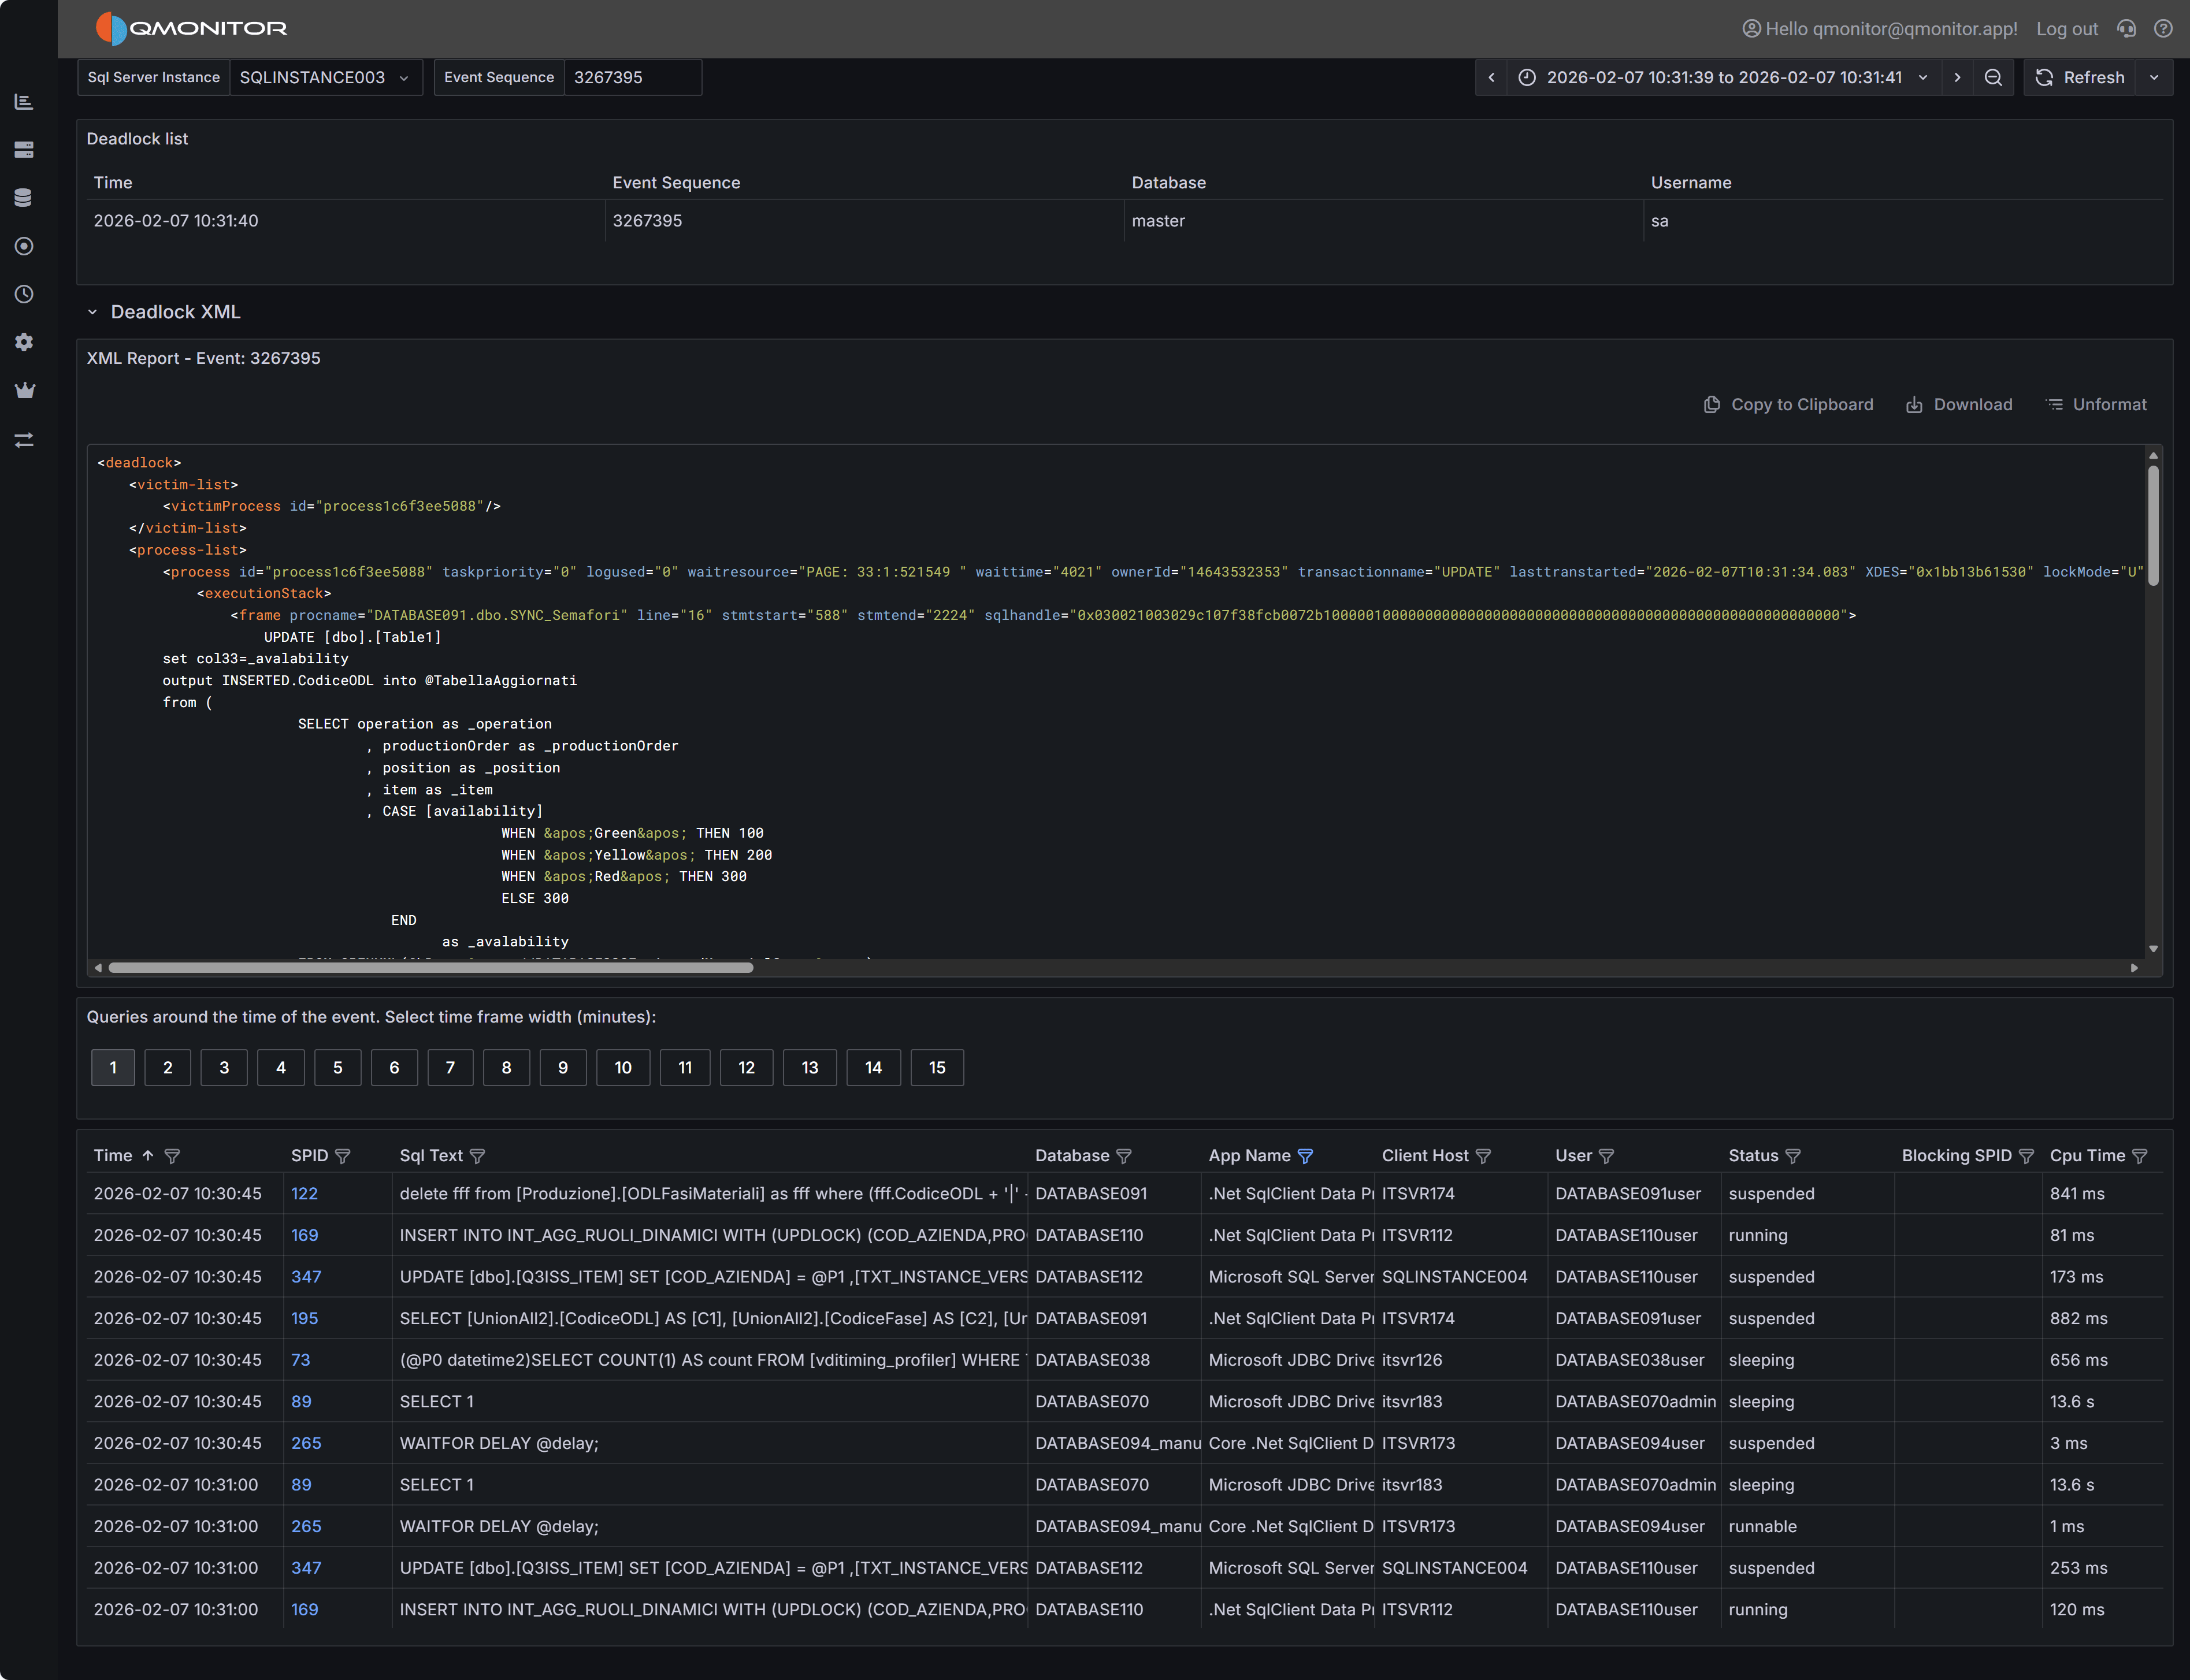 Deadlock event detail showing deadlock graph XML and active sessions
Deadlock Graph XML
The deadlock graph XML panel displays the complete XML representation of the deadlock as captured by SQL
Server. This XML contains all the information SQL Server used to detect and resolve the deadlock, making
it the authoritative source for understanding what happened.
The XML structure includes several key node types:
Process Nodes (<process>) describe each session involved in the deadlock. Each process node contains:
- The session ID (SPID) and transaction ID
- Whether the process was chosen as the deadlock victim
- The isolation level the transaction was using
- Lock mode and lock request mode
- The SQL statement being executed (in the
<inputbuf> element) - The execution stack showing which stored procedures or code paths led to the deadlock
Resource Nodes describe the database objects involved in the deadlock, such as:
<keylock> for row-level locks on index keys<pagelock> for page-level locks<objectlock> for table-level locks<ridlock> for row identifier locks on heap tables
Each resource node shows which processes own locks on the resource and which processes are waiting for
locks on that resource, revealing the circular dependency.
Owner and Waiter Lists within each resource node show the lock ownership chain. By following the
owners and waiters across resources, you can trace the deadlock cycle: Process A owns Resource 1 and
waits for Resource 2, while Process B owns Resource 2 and waits for Resource 1.
Reading the Deadlock Graph
To analyze a deadlock, start by identifying the victim process (marked with deadlock-victim="1" in
the process node). Then examine the SQL statements in all participating processes to understand what
operations were attempting to execute.
Look at the resource nodes to identify which database objects were involved. The object names are
typically shown as object IDs that you can look up in sys.objects, but the associated index IDs and
database names provide immediate context.
Trace the lock ownership chain by following the <owner-list> and <waiter-list> elements. This reveals
the exact sequence of lock requests that formed the deadlock cycle. Understanding this sequence is crucial
for determining how to prevent the deadlock.
Pay attention to the isolation levels shown in the process nodes. Higher isolation levels like REPEATABLE
READ or SERIALIZABLE hold locks longer and increase deadlock likelihood. If you see these isolation levels,
consider whether they’re truly necessary for the business logic.
Tip
SQL Server Management Studio (SSMS) has a built-in deadlock graph viewer that can visualize this XML,
making it easier to interpret the relationships between processes and resources. You can download the XML
using “Download” button and open it in SSMS to get a graphical representation of the deadlock.Active Sessions Context
The bottom grid shows sessions that were active around the time the deadlock occurred. Use the time window
buttons (1 to 15 minutes) to expand or narrow the view.
This context helps you understand the overall workload and identify whether there were other related
activities occurring simultaneously. For example, if you see multiple similar queries running at the same
time, this might indicate that concurrency issues need to be addressed at the application level through
better transaction design or job scheduling.
4 - Timeouts
Information on query timeouts
The Timeouts dashboard helps you identify and diagnose queries that exceed their configured timeout
limits before completing execution. Query timeouts occur when the time required to execute a query
exceeds the timeout value set by the client application, connection string, or command object. When a
timeout occurs, the client cancels the query and typically returns an error to the user.
Important
Query timeouts are enforced on the client side, not by SQL Server itself. When an application executes
a query, it sets a timeout period (typically 30 seconds by default for ADO.NET and many other frameworks).
If the query doesn’t complete within this period, the client connection library sends an attention signal
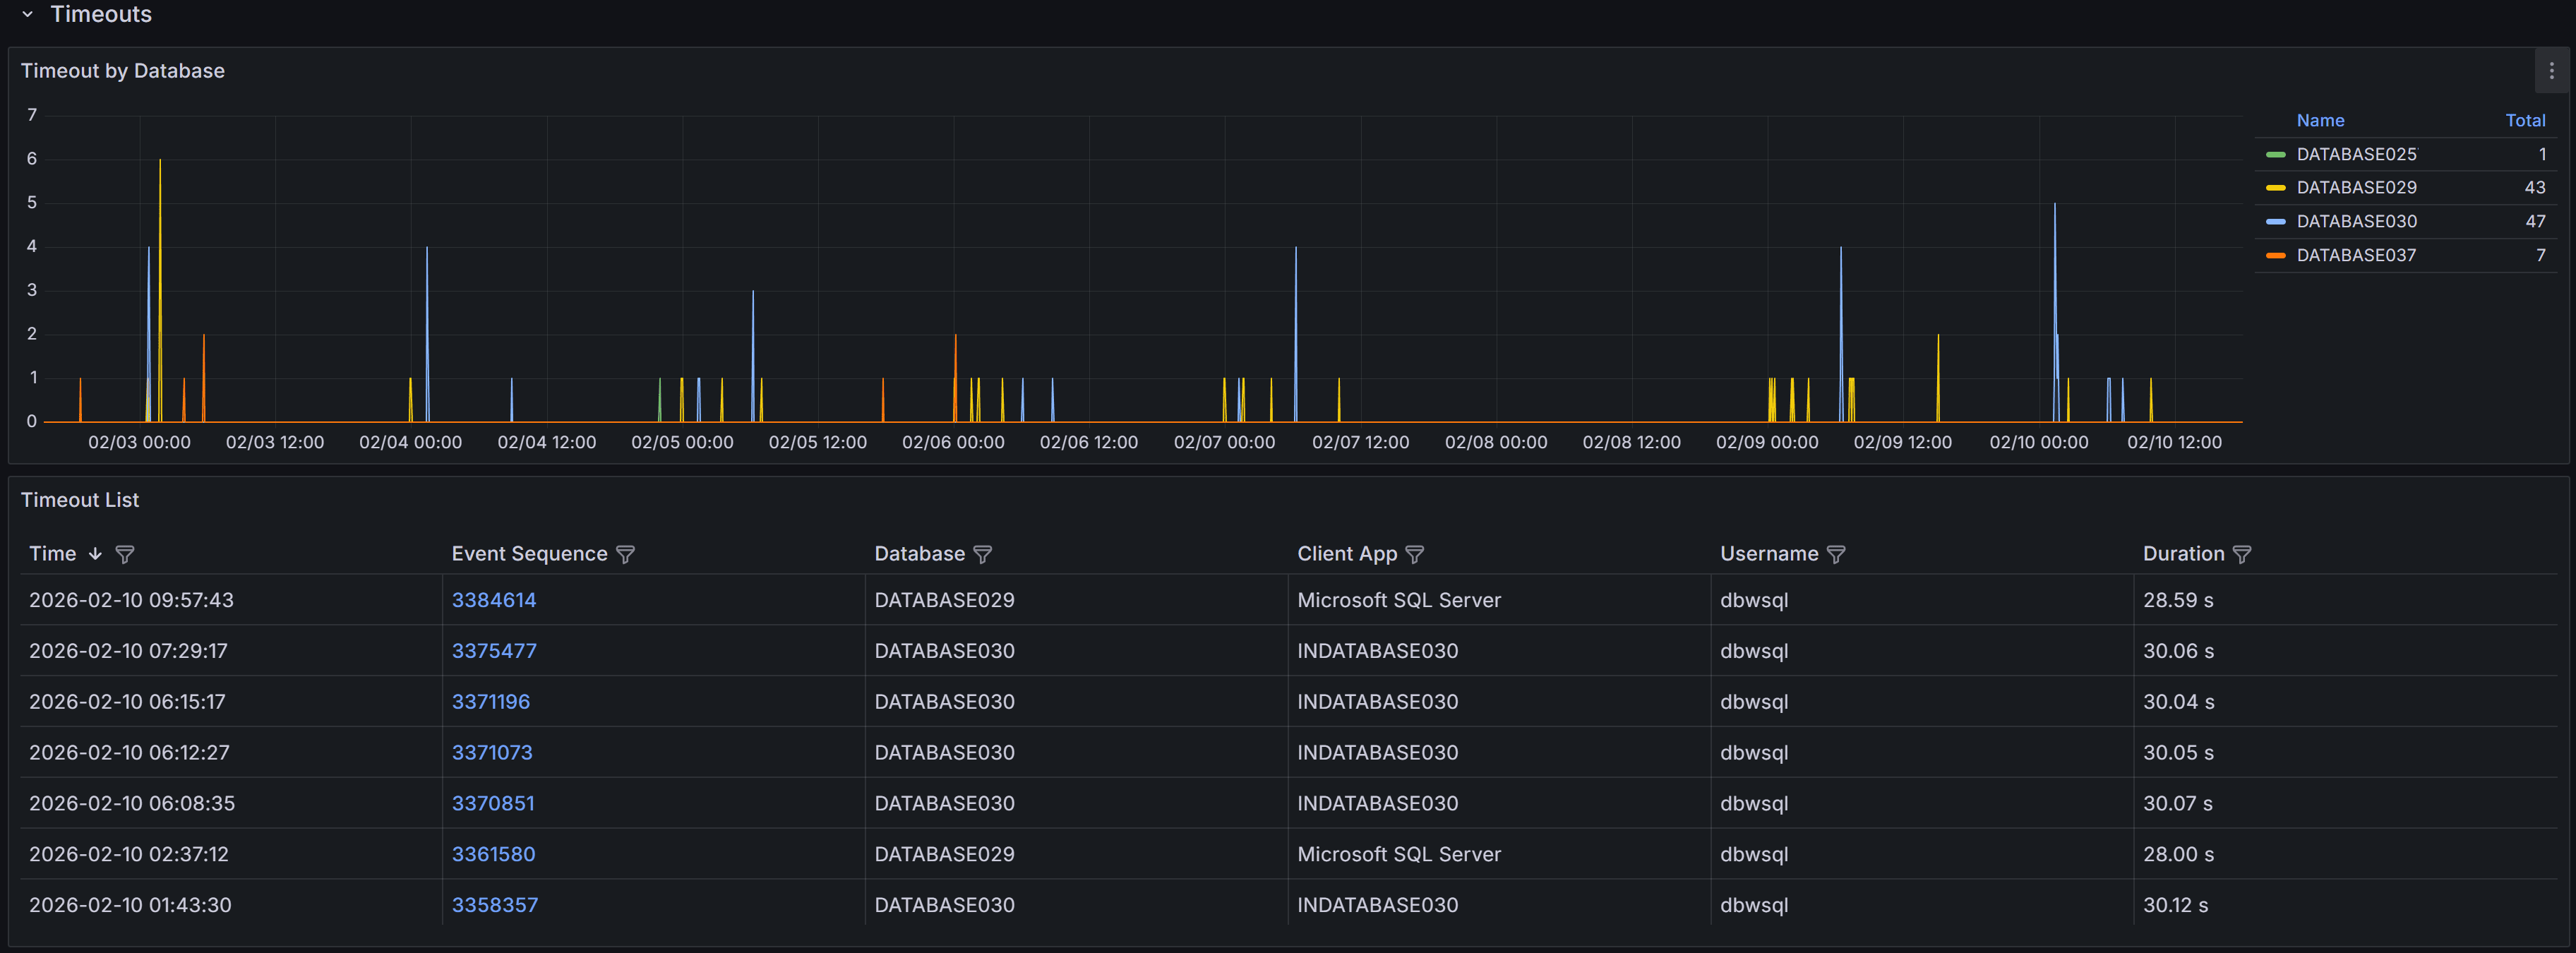
to SQL Server to cancel the query and returns a timeout error to the application.Expand the “Timeouts” row to view a chart that shows the number of timeouts
for each database.
QMonitor captures timeout events and records the error text, session details, and, when available, the
SQL text.
The timeout events table below the chart provides detailed information about each timeout occurrence:
- Time shows when the timeout occurred, helping you correlate timeouts with other activities such as
batch jobs, report generation, or peak usage periods.
- Event Sequence provides a unique identifier for the timeout event that you can reference when
investigating or communicating with team members.
- Database identifies which database the timed-out query was executing against, helping you route
investigation to the appropriate database owners.
- Duration shows how long the query had been running when it timed out. This is crucial information:
if duration is close to common timeout values (30, 60, or 120 seconds), the timeout setting may be
appropriate and the query needs optimization. If duration is much shorter, there may have been network
issues or the client may have cancelled prematurely.
- Application displays the application name from the connection string, helping you identify which
applications or services are experiencing timeout issues.
- Username shows the SQL Server login used for the connection, useful for identifying whether timeouts
are widespread or isolated to specific users or service accounts.
Use the column filters to focus on specific databases or applications, and sort by Duration to identify
whether timeouts are occurring at consistent durations (suggesting timeout setting issues) or varying
durations (suggesting query performance problems).
Timeout Event Details
When you click on a timeout event in the main table, the Timeout Detail dashboard opens with comprehensive
information to help you diagnose the root cause.
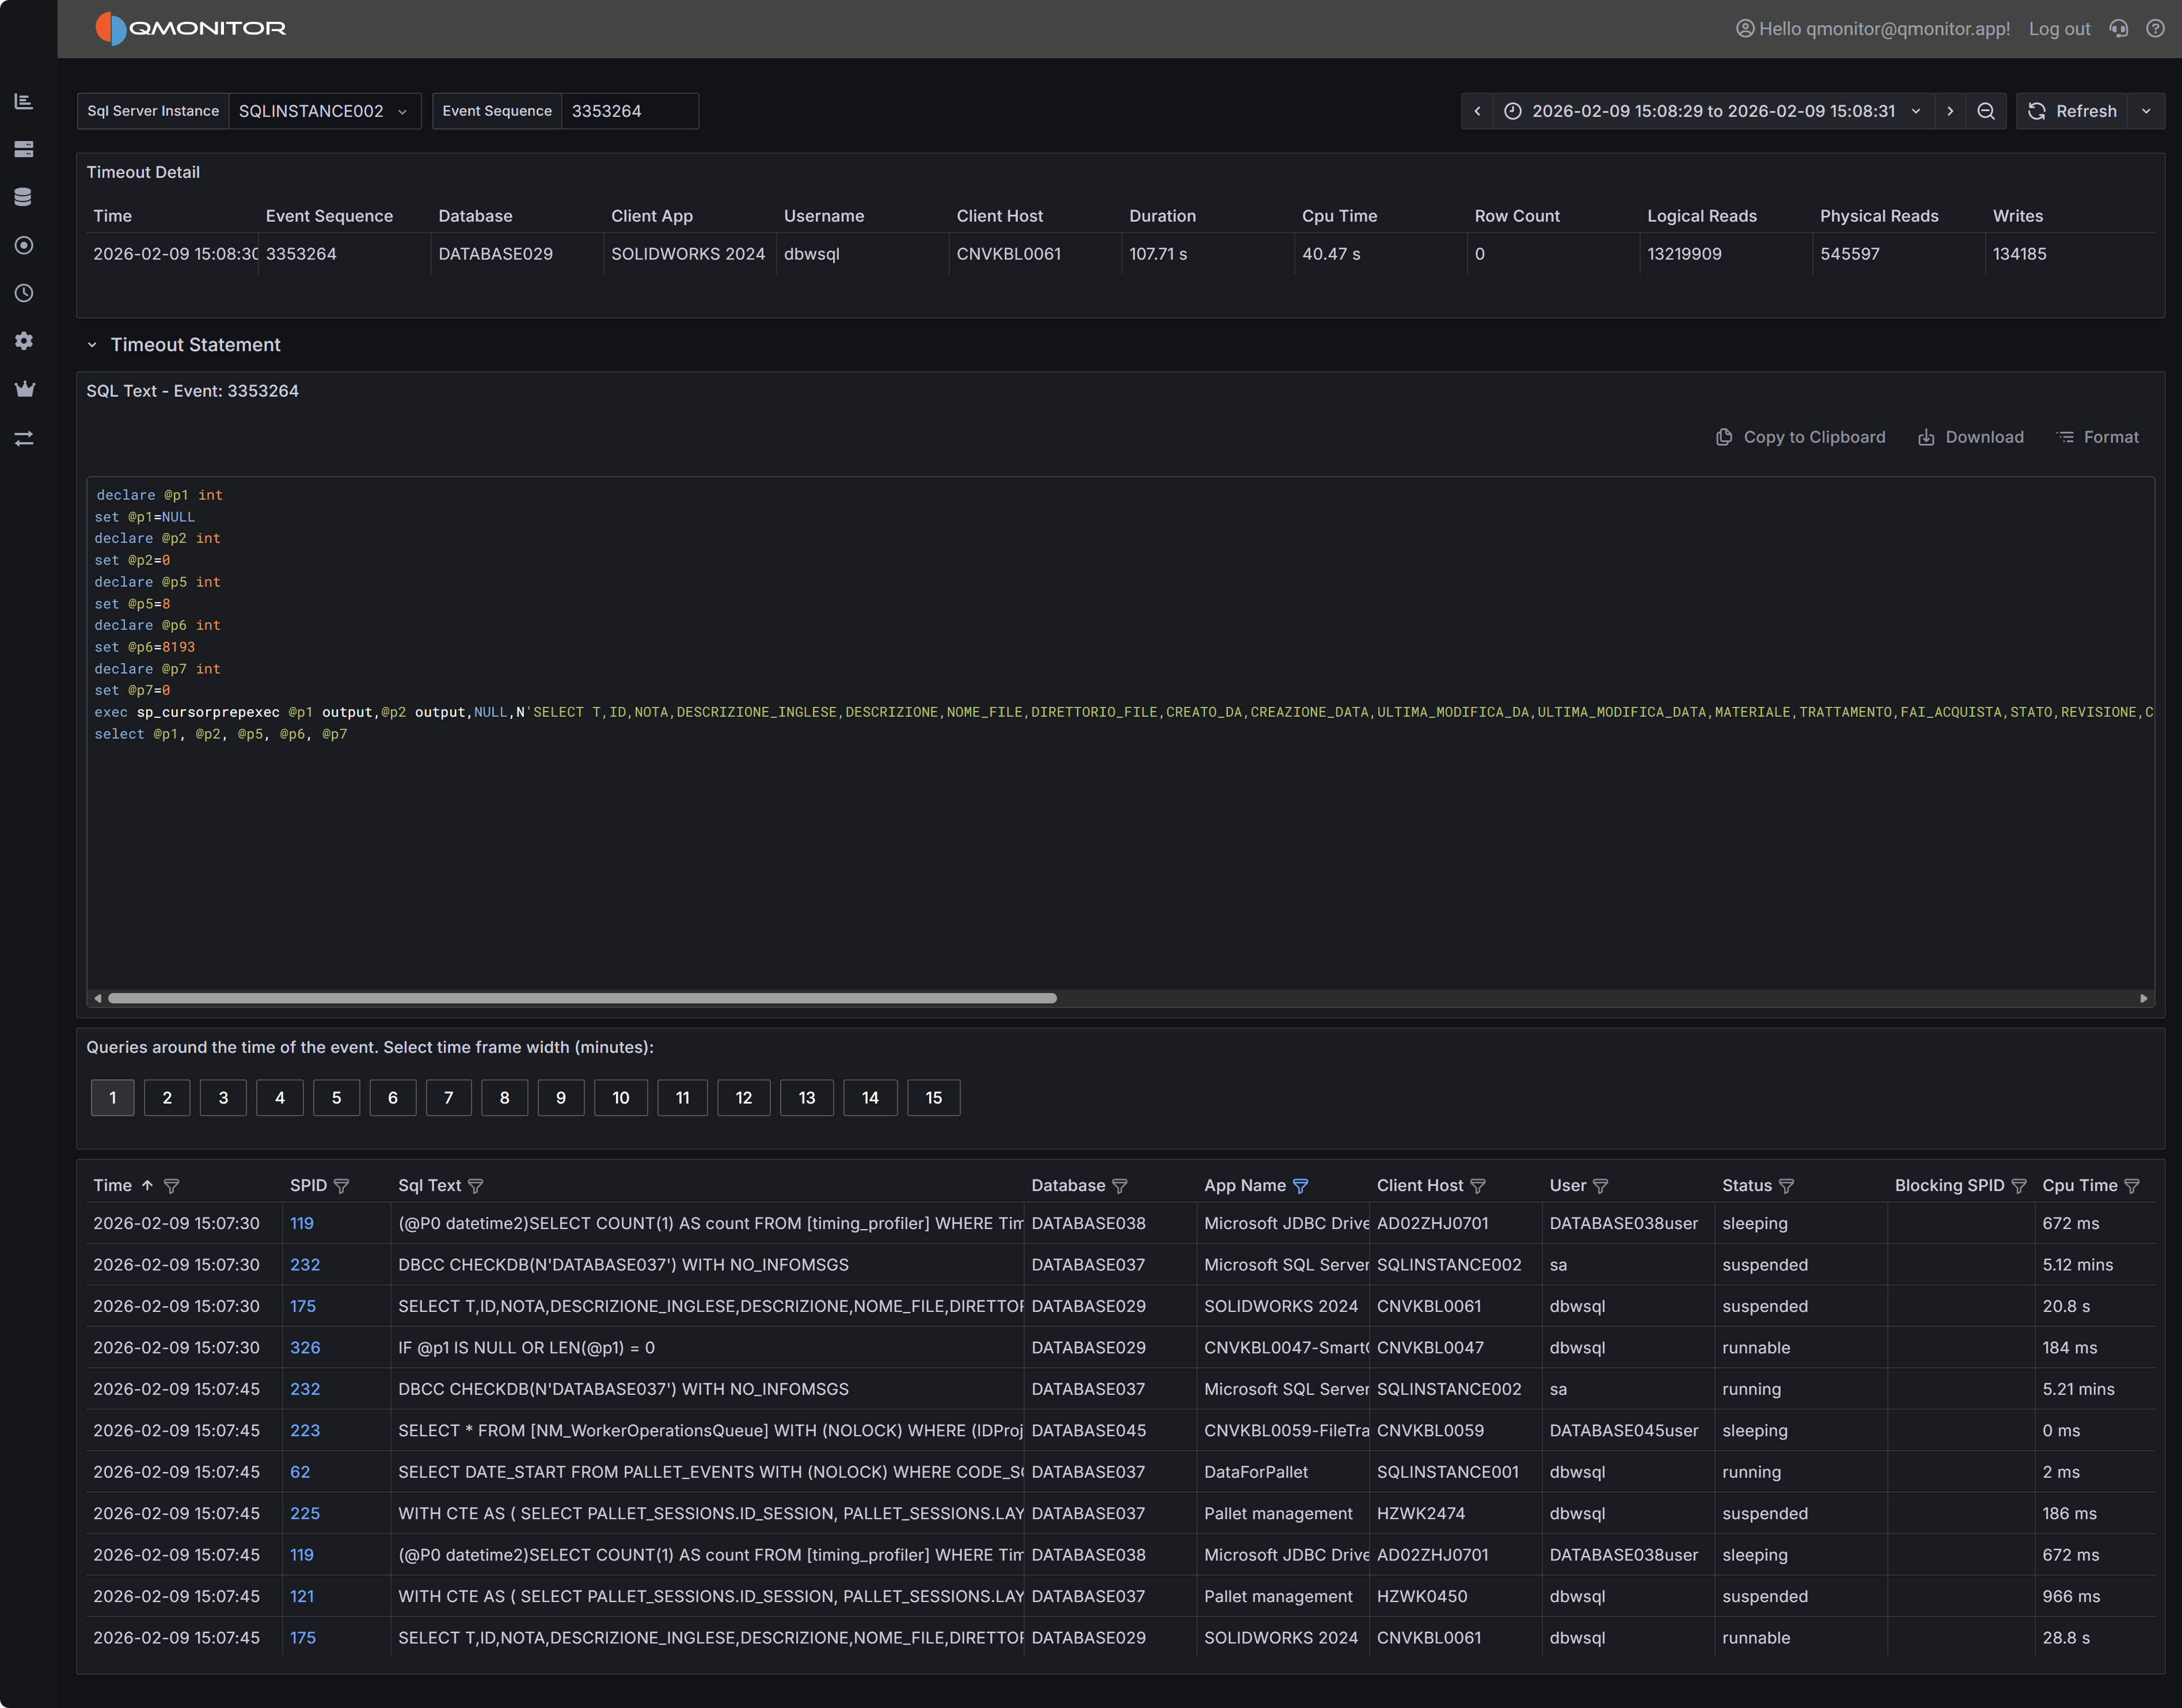 Timeout event detail showing event summary, SQL statement, and active sessions
Event Summary
The top table displays key information about the timeout event, including the exact time it occurred, the
database involved, the duration before timeout, the application name, and the username. This summary gives
you immediate context about the circumstances of the timeout.
SQL Statement
The SQL Statement panel displays the query that timed out, when this information is available. Having the
complete SQL text is essential for investigating whether the query itself needs optimization. You can copy
this text to run the query in SQL Server Management Studio with execution plans enabled to identify
expensive operators, missing indexes, or inefficient query patterns.
Note that SQL text may not be available for all timeout events. Some timeouts occur during connection
establishment or for system operations that don’t have associated SQL text. When SQL text is unavailable,
focus on the session context and timing to understand what was happening.
Active Sessions Context
The bottom grid shows all sessions that were active around the time the timeout occurred. This context is
useful for understanding whether the timeout was an isolated incident or part of broader performance
issues affecting the instance.
Use the time window buttons above the grid to adjust the view from 1 to 15 minutes before and after the
timeout. A wider window provides more context about overall instance activity, while a narrower window
focuses specifically on sessions active during the timeout.
Look for patterns in the active sessions grid:
- Blocking chains where multiple sessions are waiting on locks held by others, which may have delayed
your timed-out query
- Resource-intensive queries running concurrently that may have caused CPU or I/O contention
- Similar queries running simultaneously, indicating potential concurrency issues at the application level
- Long-running transactions that might be holding locks or consuming resources
Filter the grid to show only blocked sessions or sessions with high CPU or I/O metrics to quickly identify
potential causes of the timeout.