Always On Availability Groups
Check High Availability of databases
The Always On Availability Groups dashboard provides comprehensive visibility into the health and status of
SQL Server Always On Availability Groups across your monitored instances. This dashboard helps you quickly
verify AG configuration, monitor replica synchronization status, identify failover readiness issues, and
ensure your high availability infrastructure is operating correctly.
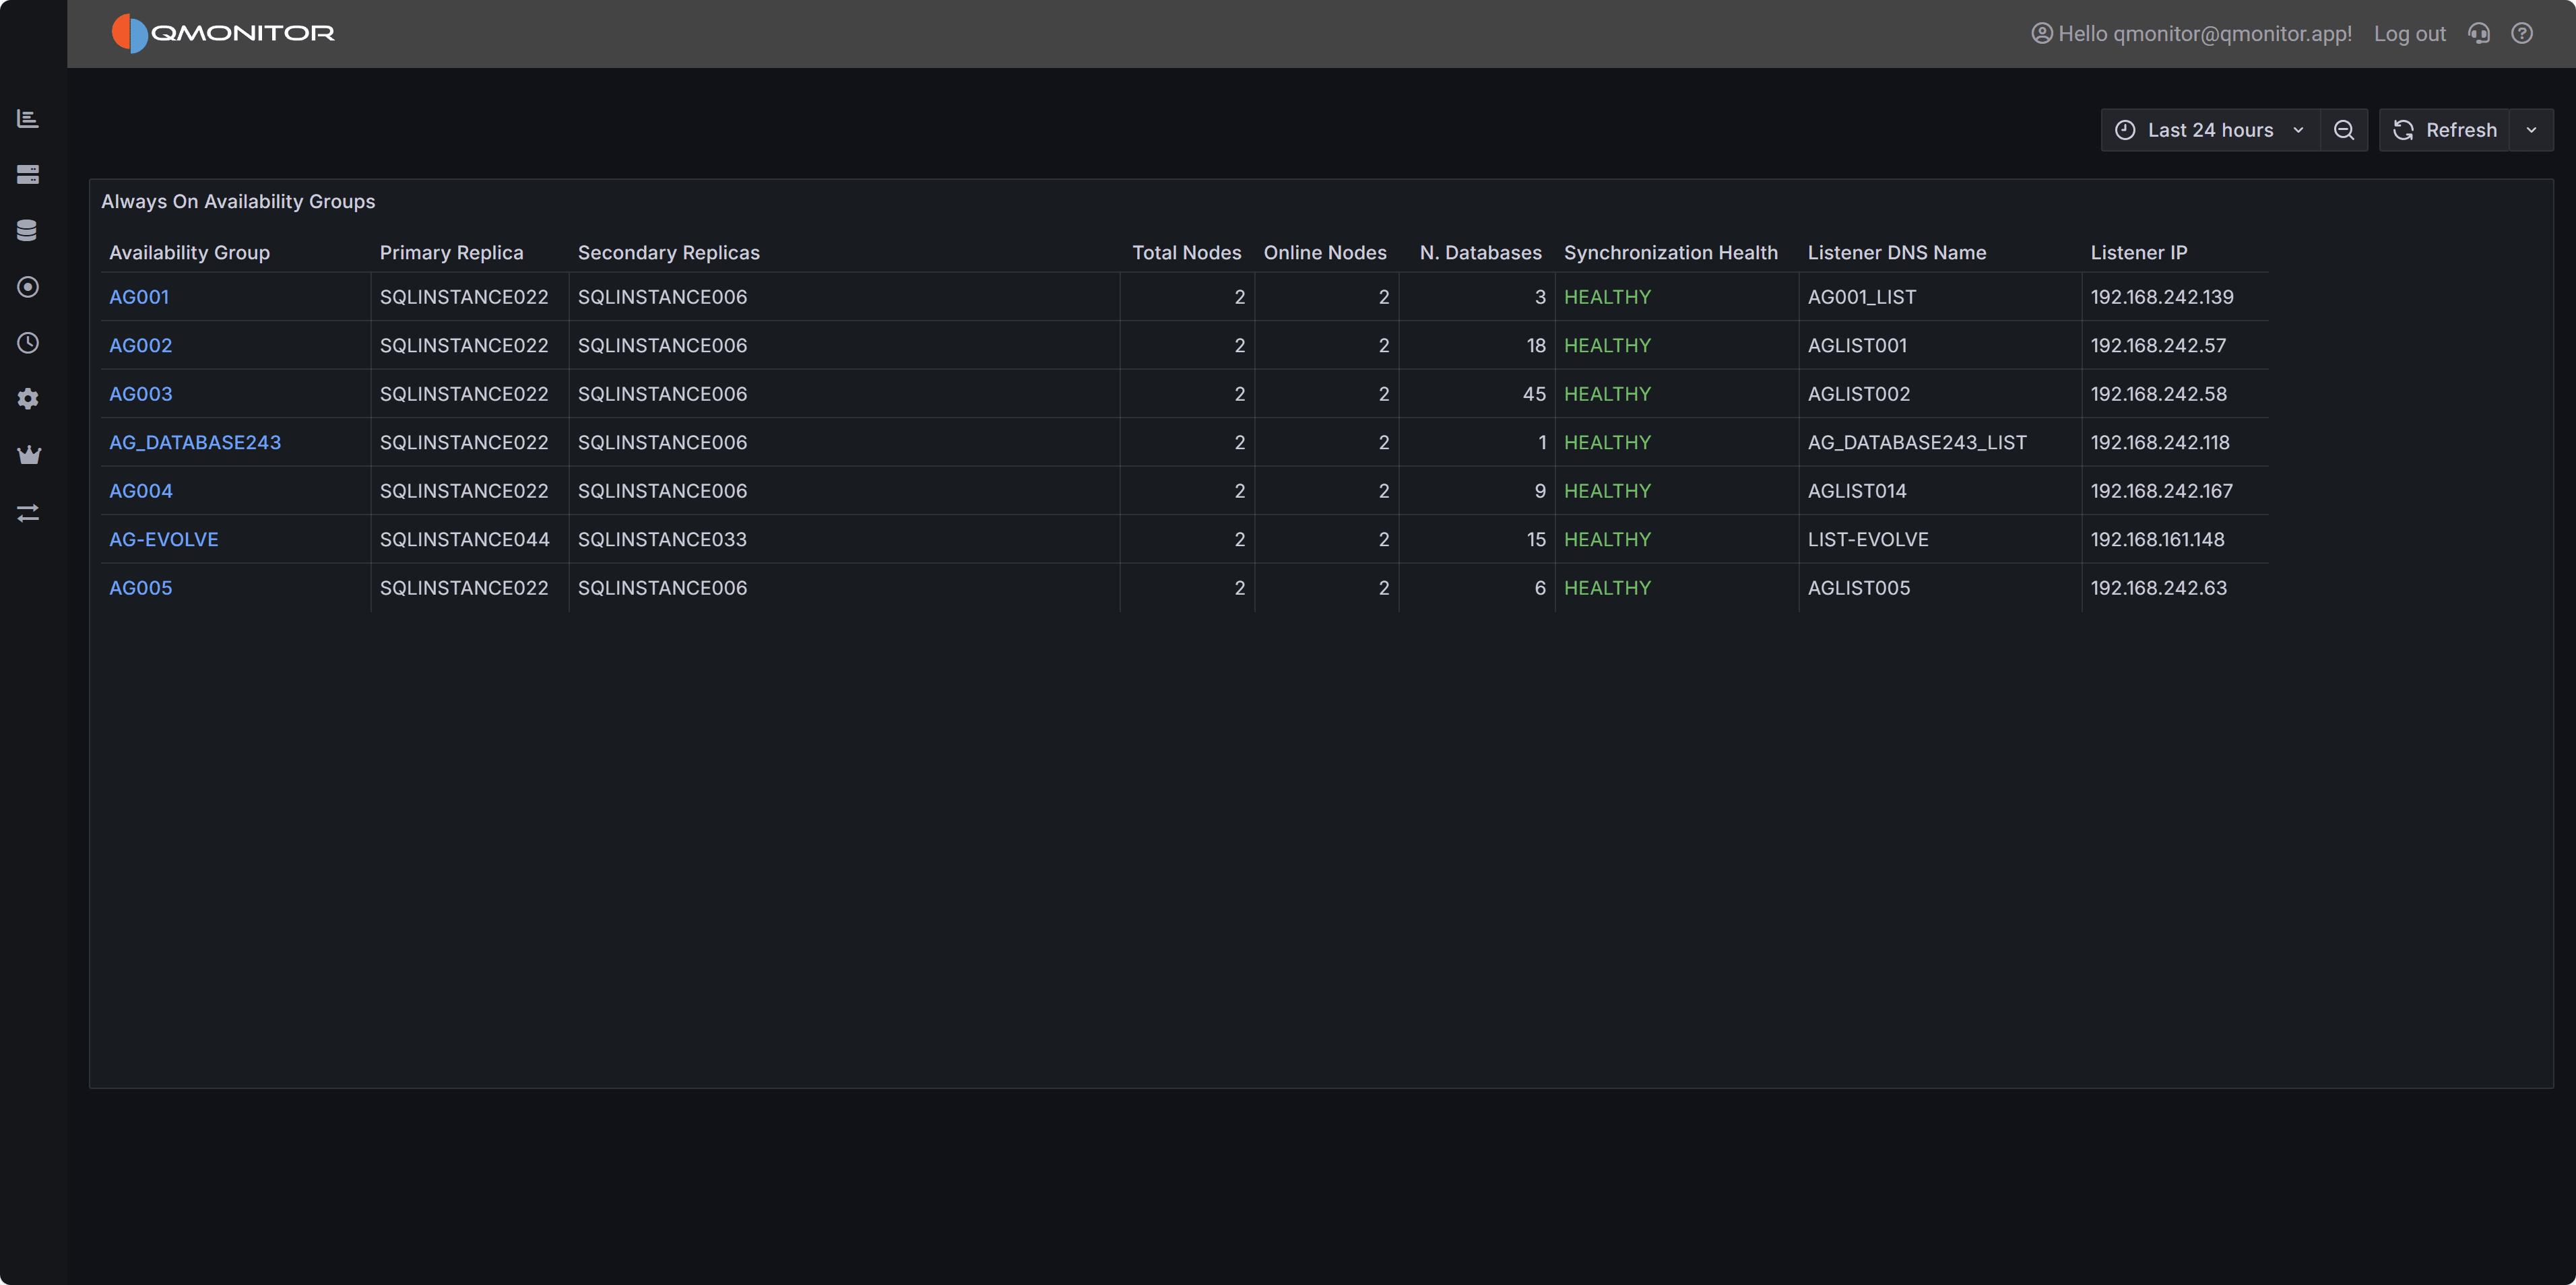 Always On Availability Groups dashboard showing AG health, replica status, and synchronization state
Dashboard Overview
The dashboard displays a summary table of all configured Availability Groups across your SQL Server estate,
making it easy to assess the health of your high availability infrastructure at a glance. Use this dashboard
to perform regular health checks, verify failover readiness, and quickly identify AGs requiring investigation
or intervention.
Availability Groups Table
The Availability Groups table provides detailed information about each configured AG:
Availability Group displays the AG name as a clickable link. Click the AG name to open the detailed
AG dashboard showing per-replica metrics, database synchronization progress, redo queue depth, and
comprehensive failover readiness information.
Primary Replica shows the current primary replica hostname. The primary replica handles all read-write
operations and is the source for transaction log records sent to secondary replicas. In a properly functioning
AG, this should match your expected primary server. If the primary is unexpected, a failover may have occurred
that requires investigation.
Secondary Replicas displays a comma-separated list of all configured secondary replica hostnames.
Secondary replicas receive transaction log records from the primary and can serve read-only workloads
depending on configuration. This column helps you quickly verify all expected replicas are configured.
Total Nodes shows the total number of replicas configured in the AG, including the primary. Most AGs
have 2-3 replicas, though SQL Server supports more for specific scenarios. This count should match your
expected AG topology.
Online Nodes displays how many replicas are currently online and reachable. This should equal Total
Nodes in a healthy AG. Values less than Total Nodes indicate one or more replicas are offline, disconnected,
or experiencing connectivity issues, a critical situation requiring immediate investigation.
N. Databases shows the number of databases protected by this AG. This helps you understand the scope
and importance of each AG. AGs protecting many databases or critical systems deserve closer monitoring.
Synchronization Health displays the overall synchronization state of the AG, typically showing “HEALTHY”
(in green) when all replicas are synchronized and failover-ready, or “NOT HEALTHY” when synchronization
issues exist. Unhealthy synchronization states indicate data protection risks and potential failover problems.
Listener DNS Name shows the AG listener’s DNS name if configured. Applications should connect to this
listener name rather than directly to instance names, allowing transparent failover without connection
string changes.
Listener IP displays the IP address or addresses associated with the AG listener. In multi-subnet
configurations, multiple IPs may appear. Verify these IPs match your expected listener configuration.
Important
When Online Nodes is less than Total Nodes, one or more replicas are offline or unreachable. This
reduces redundancy and may prevent automatic failover. Investigate immediately to restore full AG protection.Using the Dashboard
Regular Health Checks: Review this dashboard daily to verify all AGs show “HEALTHY” synchronization
status and all configured replicas are online. Early detection of synchronization issues prevents data loss
during failovers.
Drill Down for Details: Click any AG name to access the detailed AG dashboard showing replica-level
metrics including synchronization state, redo queue depth, log send rate, and database-specific synchronization
status. Use these details to diagnose synchronization delays or performance issues.
Verify After Failovers: After planned or unplanned failovers, use this dashboard to confirm the expected
server is now primary and all replicas have resynchronized. Verify listener DNS and IP addresses resolve
correctly to the new primary.
Monitor Synchronization Health: “NOT HEALTHY” status requires immediate investigation. Common causes
include network issues, replica performance problems, long-running transactions on the primary, or redo
thread bottlenecks on secondaries. The detailed AG dashboard provides metrics to pinpoint the root cause.
Track Replica Topology: Use the Total Nodes and Secondary Replicas columns to maintain awareness of
your AG configuration. Changes to expected topology may indicate configuration drift or unauthorized
modifications requiring investigation.
Tip
Listener Connectivity: Always configure and use AG listeners for application connections. Listeners
enable automatic connection redirection during failovers, eliminating manual connection string updates and
reducing application downtime.Investigating Issues
Offline Replicas: When Online Nodes is less than Total Nodes, check whether the offline replica is
stopped, whether Windows Server Failover Clustering (WSFC) quorum is healthy, whether network connectivity
exists between replicas, or whether the SQL Server service is running on the offline node.
Unhealthy Synchronization: Synchronization health issues may result from network bandwidth limitations
preventing log records from reaching secondaries quickly enough, secondary replica performance problems
causing redo queue buildup, transaction log I/O bottlenecks on primary or secondary replicas, or very
large transactions overwhelming synchronization capacity.
Unexpected Primary Replica: If the primary replica is not the expected server, determine whether a
planned failover occurred, whether an automatic failover responded to a failure, whether a manual failover
was performed without proper communication, or whether cluster node preferences have changed.
Missing or Incorrect Listener Information: Verify the listener is properly configured in Windows Server
Failover Clustering, confirm DNS records exist and resolve correctly, check that listener IP addresses are
reachable from application servers, and ensure no firewall rules block listener ports.
Use the Instance Overview dashboard to check resource utilization, performance
metrics, and wait statistics on primary and secondary replicas. High CPU, memory pressure, or I/O bottlenecks
can impact AG synchronization performance.
Review the Blocking and Deadlocks dashboards if synchronization
issues correlate with locking problems. Long-running transactions holding locks can delay log truncation and
impact AG performance.
Check the SQL Server I/O Analysis dashboard to evaluate transaction log write
performance on both primary and secondary replicas. Slow log I/O directly impacts synchronization speed and
data protection.
Synchronous vs Asynchronous Commit
Synchronous commit mode provides zero data loss but requires waiting
for secondary replica acknowledgment, potentially impacting transaction performance. Asynchronous commit mode
offers better performance but allows potential data loss during failover.
Only synchronous commit mode is suitable for high availability, while asynchronous commit may be appropriate
for disaster recovery scenarios or for offloading read-only workloads to secondary replicas.
1 - Always On Availability Group Detail
Check the state of a High Availability Group
The Always On Availability Group Detail dashboard provides comprehensive health and replication metrics for
a single Availability Group, allowing you to monitor replica status, track failover history, analyze data
movement performance, and identify synchronization issues. This dashboard is essential for troubleshooting
AG problems, verifying failover readiness, and ensuring your high availability infrastructure operates optimally.
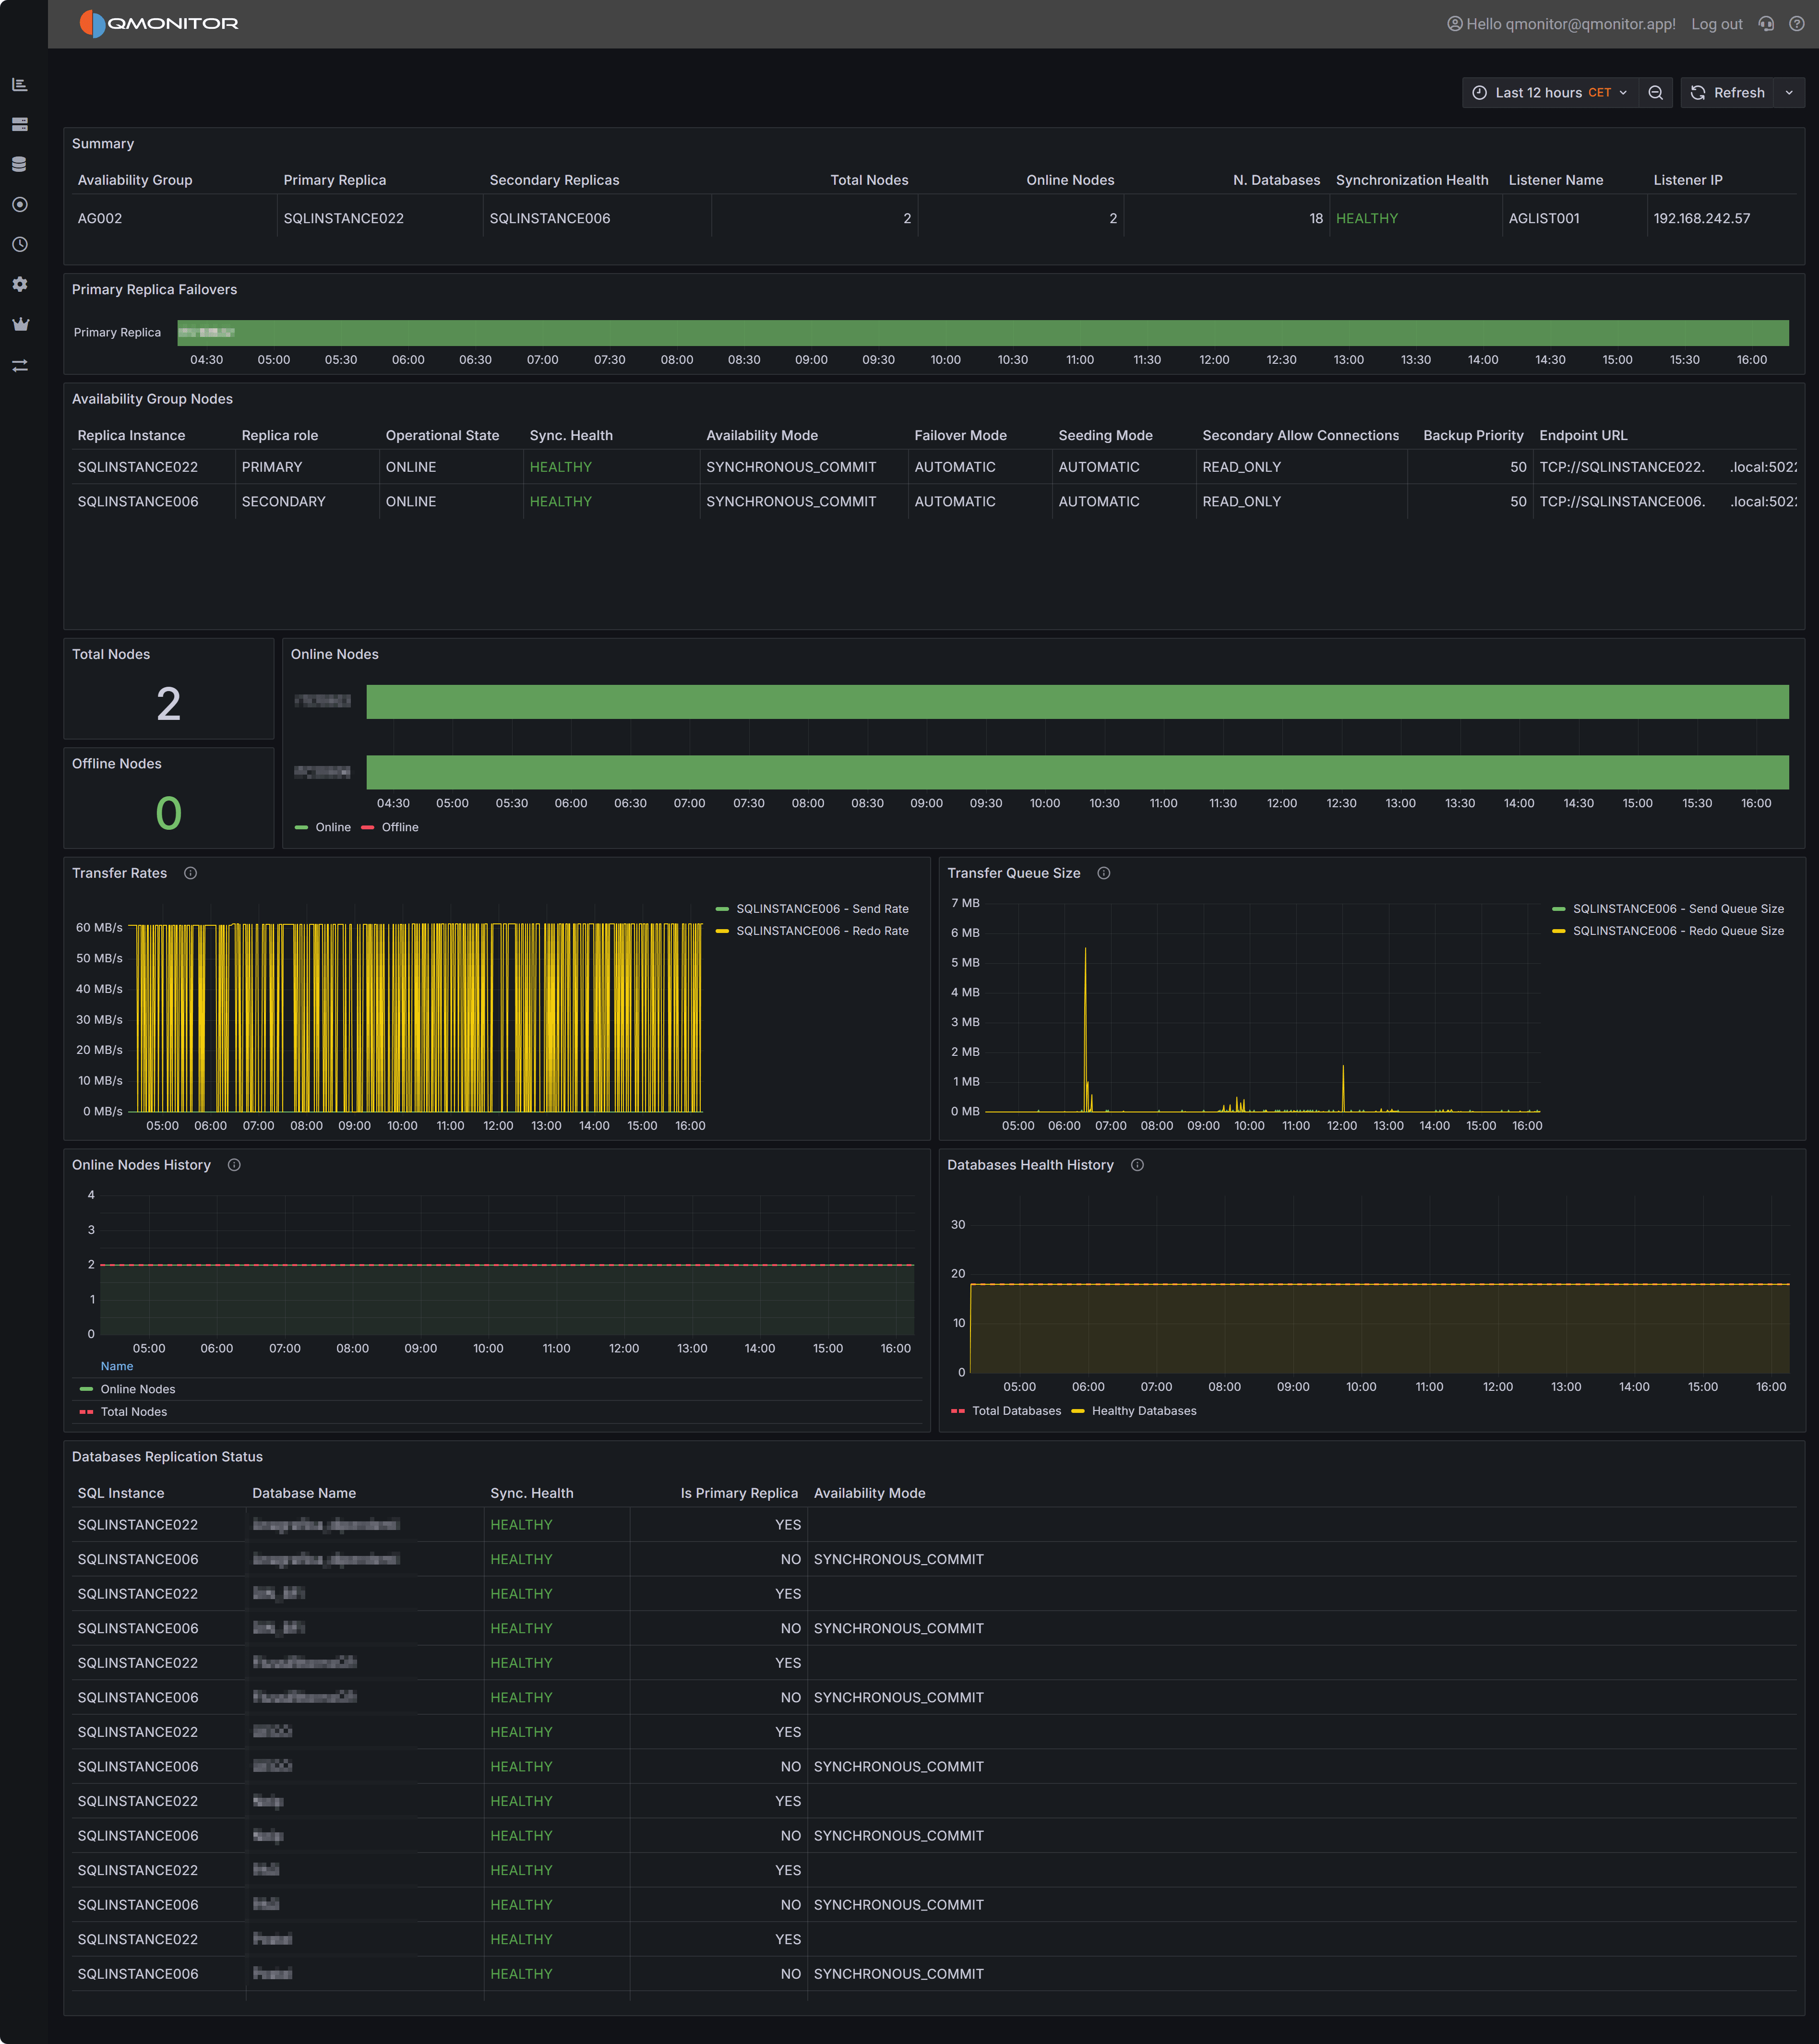 Availability Group Detail dashboard showing replica health, failover history, and replication metrics
Dashboard Sections
AG Summary
The summary section at the top displays key information about the Availability Group configuration and
current state:
Availability Group displays the AG name for reference.
Primary Replica shows the current primary replica hostname. This is the replica handling all read-write
operations and serving as the transaction log source for secondary replicas.
Secondary Replicas lists all configured secondary replica hostnames, showing your AG topology at a glance.
Total Nodes displays the total number of replicas configured in the AG, including primary and all secondaries.
Online Nodes shows how many replicas are currently online and reachable. This should equal Total Nodes
in a healthy AG. Lower values indicate offline replicas that reduce redundancy and may prevent automatic failover.
N. Databases shows the number of databases protected by this AG.
Synchronization Health displays the overall synchronization state, typically “HEALTHY” when all databases
on all replicas are synchronized and ready for failover, or showing issues when synchronization problems exist.
Listener Name displays the AG listener’s DNS name if configured. Applications should connect via this
listener for automatic failover support.
Listener IP shows the IP address or addresses associated with the listener.
Primary Replica Failovers
The Primary Replica Failovers timeline visualizes which replica was primary at each point during the
selected time range. This horizontal timeline shows the primary role assignment over time, with color-coded
bars indicating which server held the primary role during each period.
Use this timeline to review recent failover history and understand failover frequency and patterns. Frequent
failovers may indicate instability, while unexpected failovers during business hours require investigation.
Correlate failover times with events from the Instance Overview or Events dashboards to identify what
triggered role changes—planned maintenance, automatic failover due to health detection, or manual intervention.
Availability Group Nodes
The Availability Group Nodes table provides detailed configuration and status information for each replica:
Replica Instance shows the SQL Server instance name for each replica in the AG.
Replica role indicates whether the replica is currently PRIMARY or SECONDARY. Only one replica is primary
at any time.
Operational State shows the current operational status of each replica (ONLINE, OFFLINE, etc.).
Sync. Health displays the per-replica synchronization status. “HEALTHY” indicates the replica is properly
synchronized with the primary. Unhealthy states indicate synchronization problems requiring investigation.
Availability Mode shows whether the replica uses SYNCHRONOUS_COMMIT (waits for secondary acknowledgment
before committing transactions, ensuring zero data loss) or ASYNCHRONOUS_COMMIT (commits without waiting,
better performance but potential data loss during failover).
Failover Mode indicates whether the replica supports AUTOMATIC failover (can automatically become primary
if the current primary fails) or MANUAL failover (requires manual intervention to become primary).
Seeding Mode shows whether the replica uses AUTOMATIC seeding (SQL Server automatically copies database
files to initialize the replica) or MANUAL seeding (database files must be manually restored).
Secondary Allow Connections displays the read-intent settings for secondary replicas: NO (no connections
allowed), READ_ONLY (only read-only connections allowed), or ALL (all connections allowed).
Backup Priority shows the priority value used for backup preference routing. Higher values indicate
preferred backup targets when using AG-aware backup strategies.
Endpoint URL displays the database mirroring endpoint URL used for data movement between replicas.
R/O Routing URL shows the read-only routing address if configured, used to direct read-only queries to
secondary replicas.
R/W Routing URL displays the read-write routing address if configured.
Important
Only replicas configured with SYNCHRONOUS_COMMIT and AUTOMATIC failover mode can participate in automatic
failover. Asynchronous replicas or those with manual failover mode require manual intervention during
primary failures, potentially increasing downtime.Node Availability Metrics
The Node Availability section provides KPIs and visualization of replica online status:
Total Nodes KPI shows the configured replica count for quick reference.
Offline Nodes KPI displays how many replicas are currently offline. This should be 0 in a healthy AG.
Online Nodes chart plots the number of online replicas over time during the selected interval. A
consistently flat line at the total node count indicates stable availability. Dips indicate periods when
replicas went offline, while fluctuating lines suggest flapping replicas with intermittent connectivity issues.
Transfer Rates and Queue Sizes
These charts visualize data movement performance between primary and secondary replicas:
Transfer Rates chart displays:
- Send Rate: How fast the primary replica sends transaction log records to secondaries, measured in
MB/s or KB/s. Higher values indicate more transaction activity requiring replication.
- Redo Rate: How fast secondary replicas apply received transaction log records to their databases.
Redo rate should keep pace with send rate to maintain synchronization.
Low or decreasing redo rates on secondaries indicate performance bottlenecks. Common causes include slow
storage I/O on secondaries, CPU pressure preventing redo threads from keeping up, or blocking on secondaries
due to read workloads holding locks that conflict with redo operations.
Transfer Queue Size chart shows:
- Send Queue Size: Amount of transaction log data (in KB or MB) waiting on the primary to be sent to
secondaries. Growing send queues indicate network bandwidth limitations or secondary connectivity issues.
- Redo Queue Size: Amount of transaction log data received by secondaries but not yet applied. Growing
redo queues indicate secondaries cannot keep pace with transaction volume, creating synchronization lag
that increases RPO (potential data loss during failover) and may delay failover readiness.
Warning
Large Redo Queues Impact Failover: High redo queue sizes mean secondaries are behind the primary and
need time to catch up before becoming failover-ready. During automatic failover, SQL Server waits for redo
queue processing, increasing failover duration and application downtime. Monitor and address redo queue
buildup proactively.Health History
The health history section provides time-series visualization of AG health trends:
Online Nodes History chart plots total nodes versus online nodes over time, showing historical availability
patterns. Consistent alignment between total and online nodes indicates stable replica availability. Gaps
indicate periods with offline replicas.
Database Health History chart shows total databases in the AG versus healthy databases over time. When
these lines separate, one or more databases have become unsynchronized or unhealthy, requiring investigation.
This may result from synchronization issues, suspended data movement, or database-specific problems.
Databases Replication Status
The Databases Replication Status table provides per-database synchronization details across all replicas:
SQL Instance shows which replica hosts each database copy.
Database Name identifies the database.
Sync. Health displays the synchronization status for this database on this replica. “HEALTHY” indicates
proper synchronization with the primary, while other states indicate issues.
Is Primary Replica shows whether this row represents the primary copy (YES) or a secondary copy (NO).
Availability Mode displays the availability mode for this database replica, typically inheriting from
the AG-level configuration but potentially overridden per database in some configurations.
Use this table to identify which specific databases have synchronization problems when overall AG health
shows issues. Sort by Sync. Health to find unhealthy databases requiring attention. Filter by specific
databases to see their status across all replicas.
Investigating Synchronization Issues
Growing Redo Queues: When redo queue sizes increase steadily, investigate secondary replica performance.
Check the Instance Overview dashboard for the secondary—look for high CPU utilization, memory pressure, or
I/O bottlenecks. Review the SQL Server error log on secondaries for redo thread errors or warnings. Consider
whether read workloads on secondaries are causing blocking that interferes with redo operations.
Low Redo Rates: Consistently low redo rates relative to send rates indicate secondaries cannot keep pace
with transaction volume. This may result from undersized hardware on secondaries compared to the primary,
slow transaction log storage on secondaries, or configuration issues like insufficient max worker threads.
Increasing Send Queues: Growing send queues usually indicate network bandwidth limitations between
replicas or secondary replicas that are offline or unreachable. Verify network connectivity, check for
network saturation during peak periods, and ensure Windows Server Failover Clustering quorum is healthy.
Unhealthy Database Synchronization: Individual database synchronization issues may result from suspended
data movement (check sys.dm_hadr_database_replica_states), insufficient secondary storage space preventing
log application, or database-specific errors on the secondary (check SQL Server error log).
Frequent Failovers: Review the Primary Replica Failovers timeline to identify failover frequency and
timing. Correlate failover times with system events, resource pressure, or operational activities. Unexpected
automatic failovers may indicate intermittent primary replica health issues, aggressive health detection
timeout settings, or network instability causing false failure detection.
Use the Instance Overview dashboard to check resource utilization and performance
metrics on both primary and secondary replicas. High CPU, memory pressure, or I/O bottlenecks directly impact
AG synchronization performance.
Review the SQL Server I/O Analysis dashboard to evaluate transaction log
write performance on all replicas. Slow log I/O increases redo queue buildup and synchronization lag.
Check the Blocking dashboard if synchronization issues correlate with read workloads
on secondary replicas. Blocking can interfere with redo thread operations and slow synchronization.
Monitor the Capacity Planning dashboard to ensure secondary replicas have
adequate resources to handle both read workloads and redo operations without contention.
Best Practice
Regular Failover Testing: Periodically perform planned manual failovers during maintenance windows to
verify automatic failover readiness, validate application connection failover behavior, and ensure all
replicas can successfully assume the primary role. This validates your high availability configuration before
an actual failure occurs.